

Examples
Basic Scripts
Simple starter scripts covering the fundamentals — plotting, candles, moving averages, and indicator structure.
Plot Example
The simplest possible script — plots the closing price.
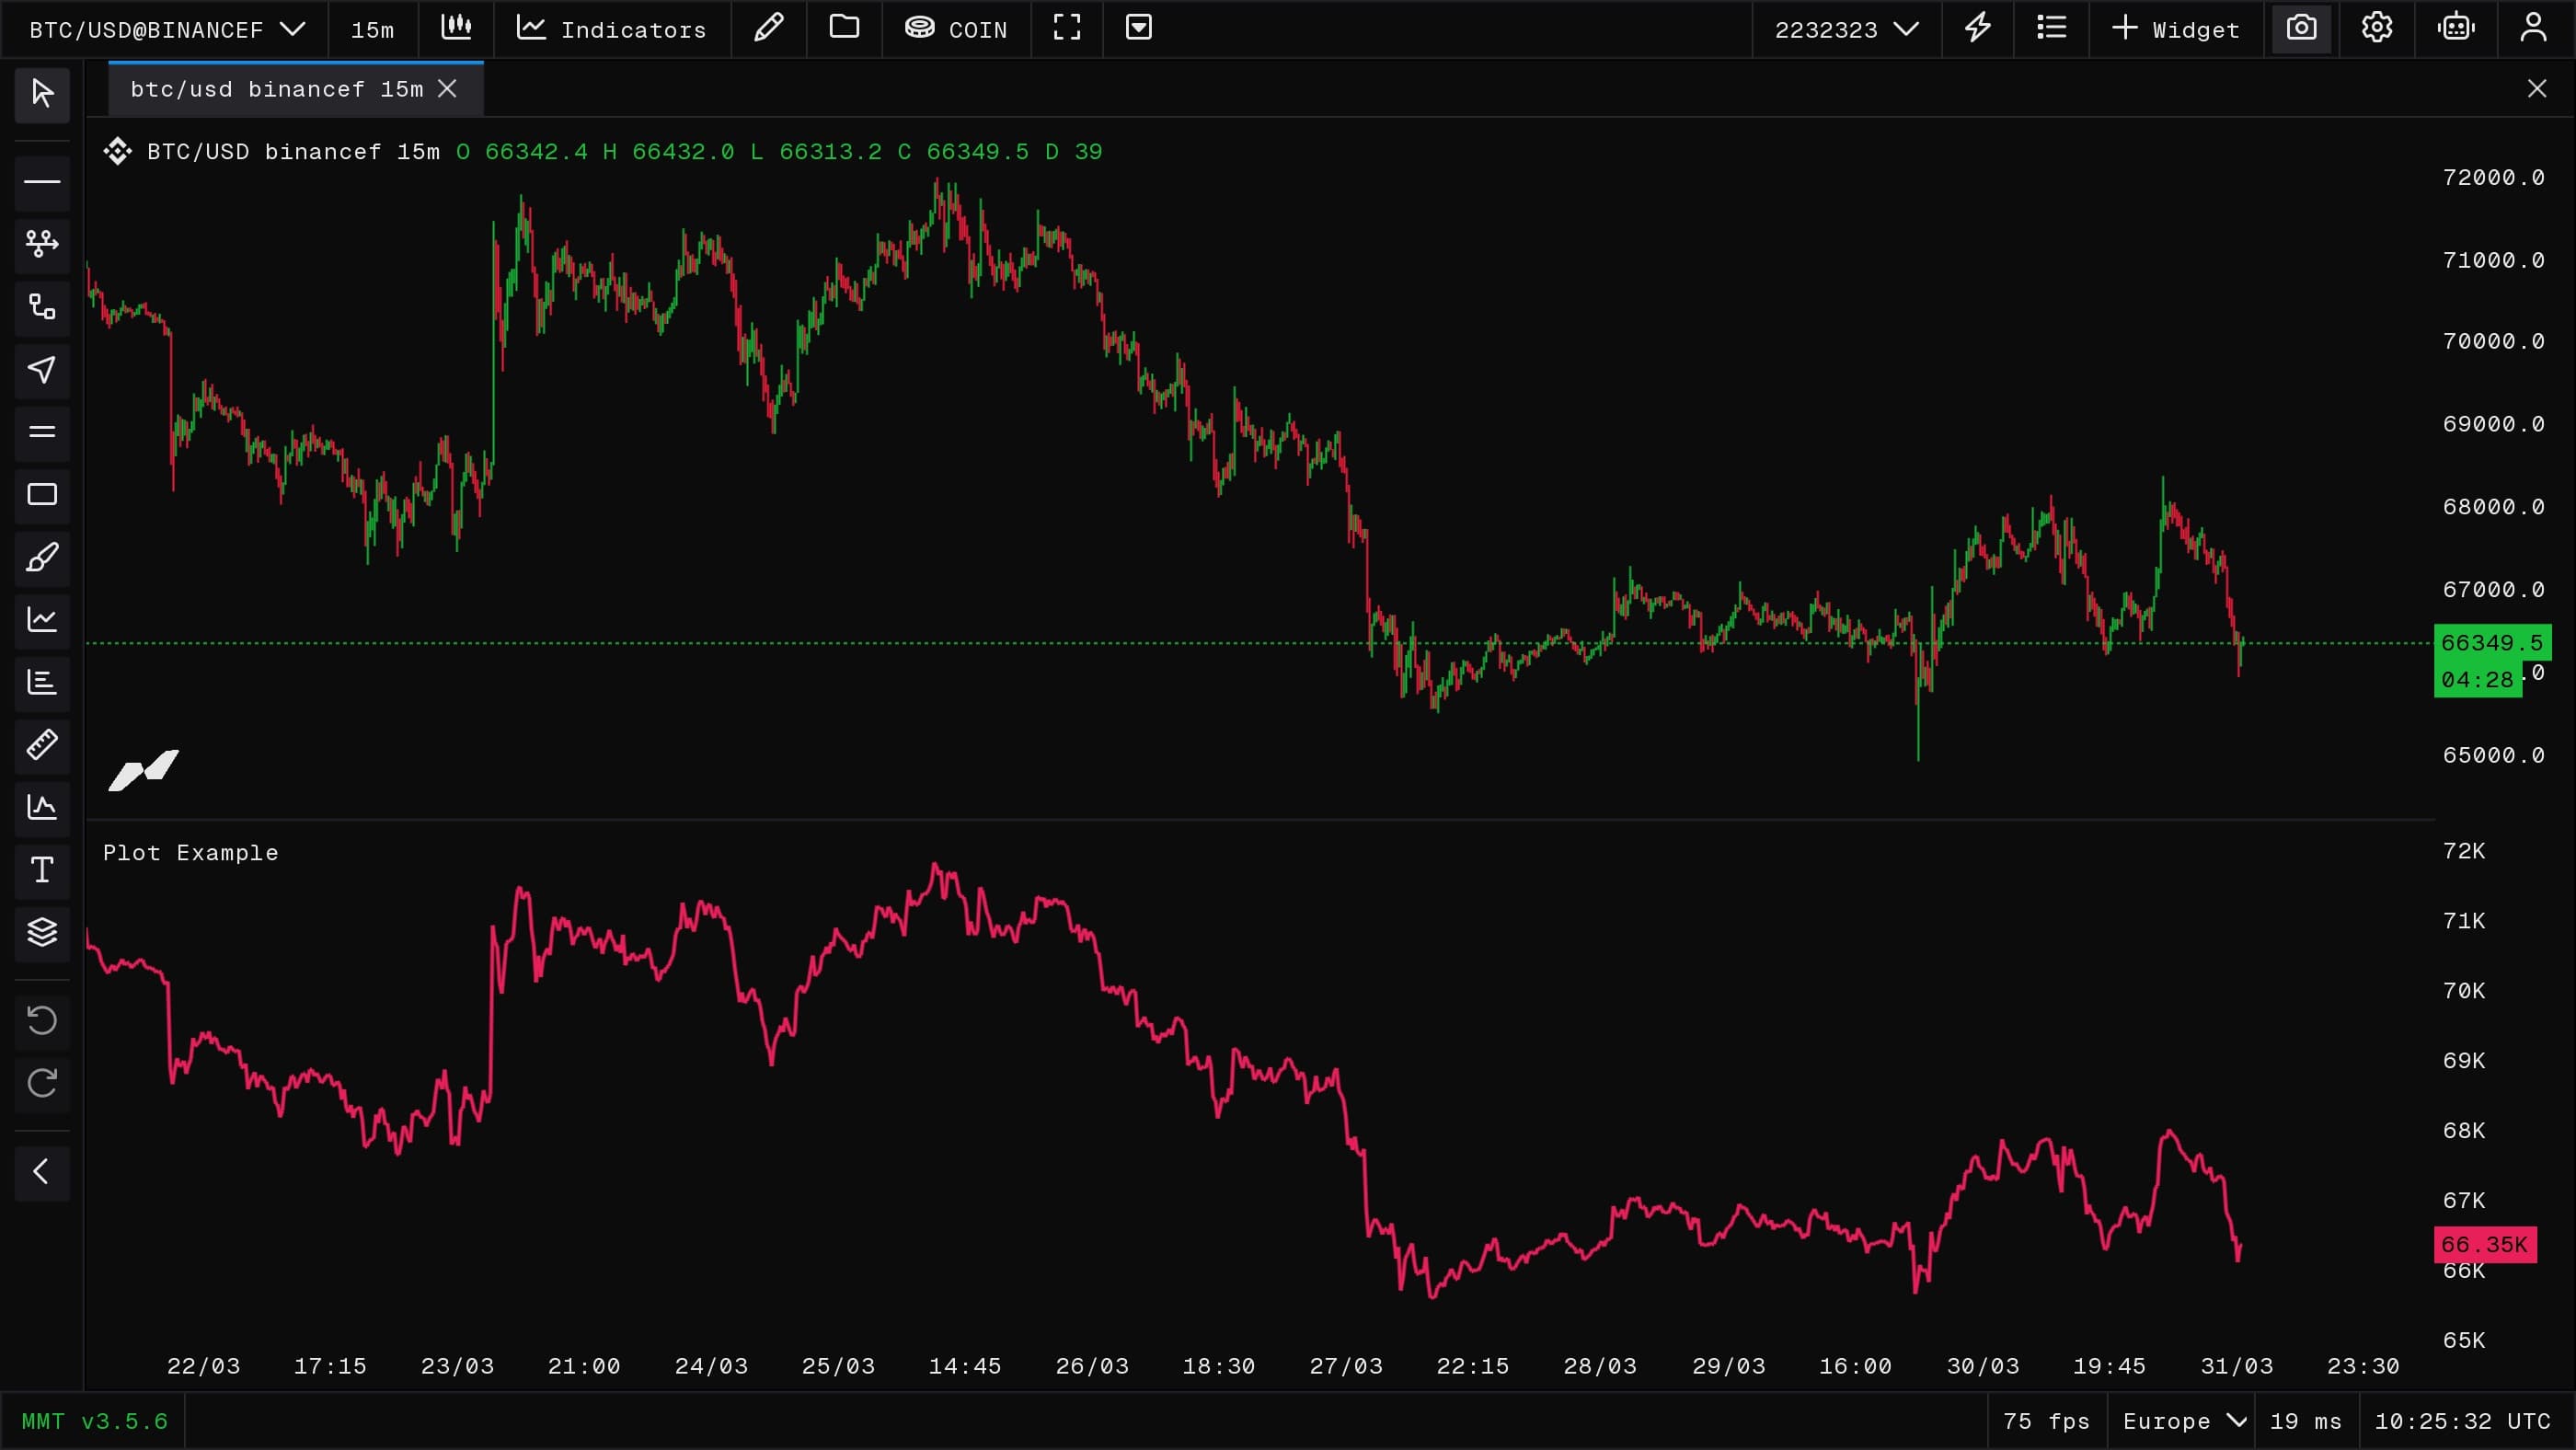
//@version=2
indicator("Plot Example", false);

const candles = subscribe(data.OHLCV);

function onBar() {
  const close = candles.close();
  plot("Close", close, { color: color.red, width: 2 });
}
Moving Average
Two EMAs with a filled region between them — green when the fast EMA is above the slow, red when below. Demonstrates fill(), color.transp(), and sameLine inputs.
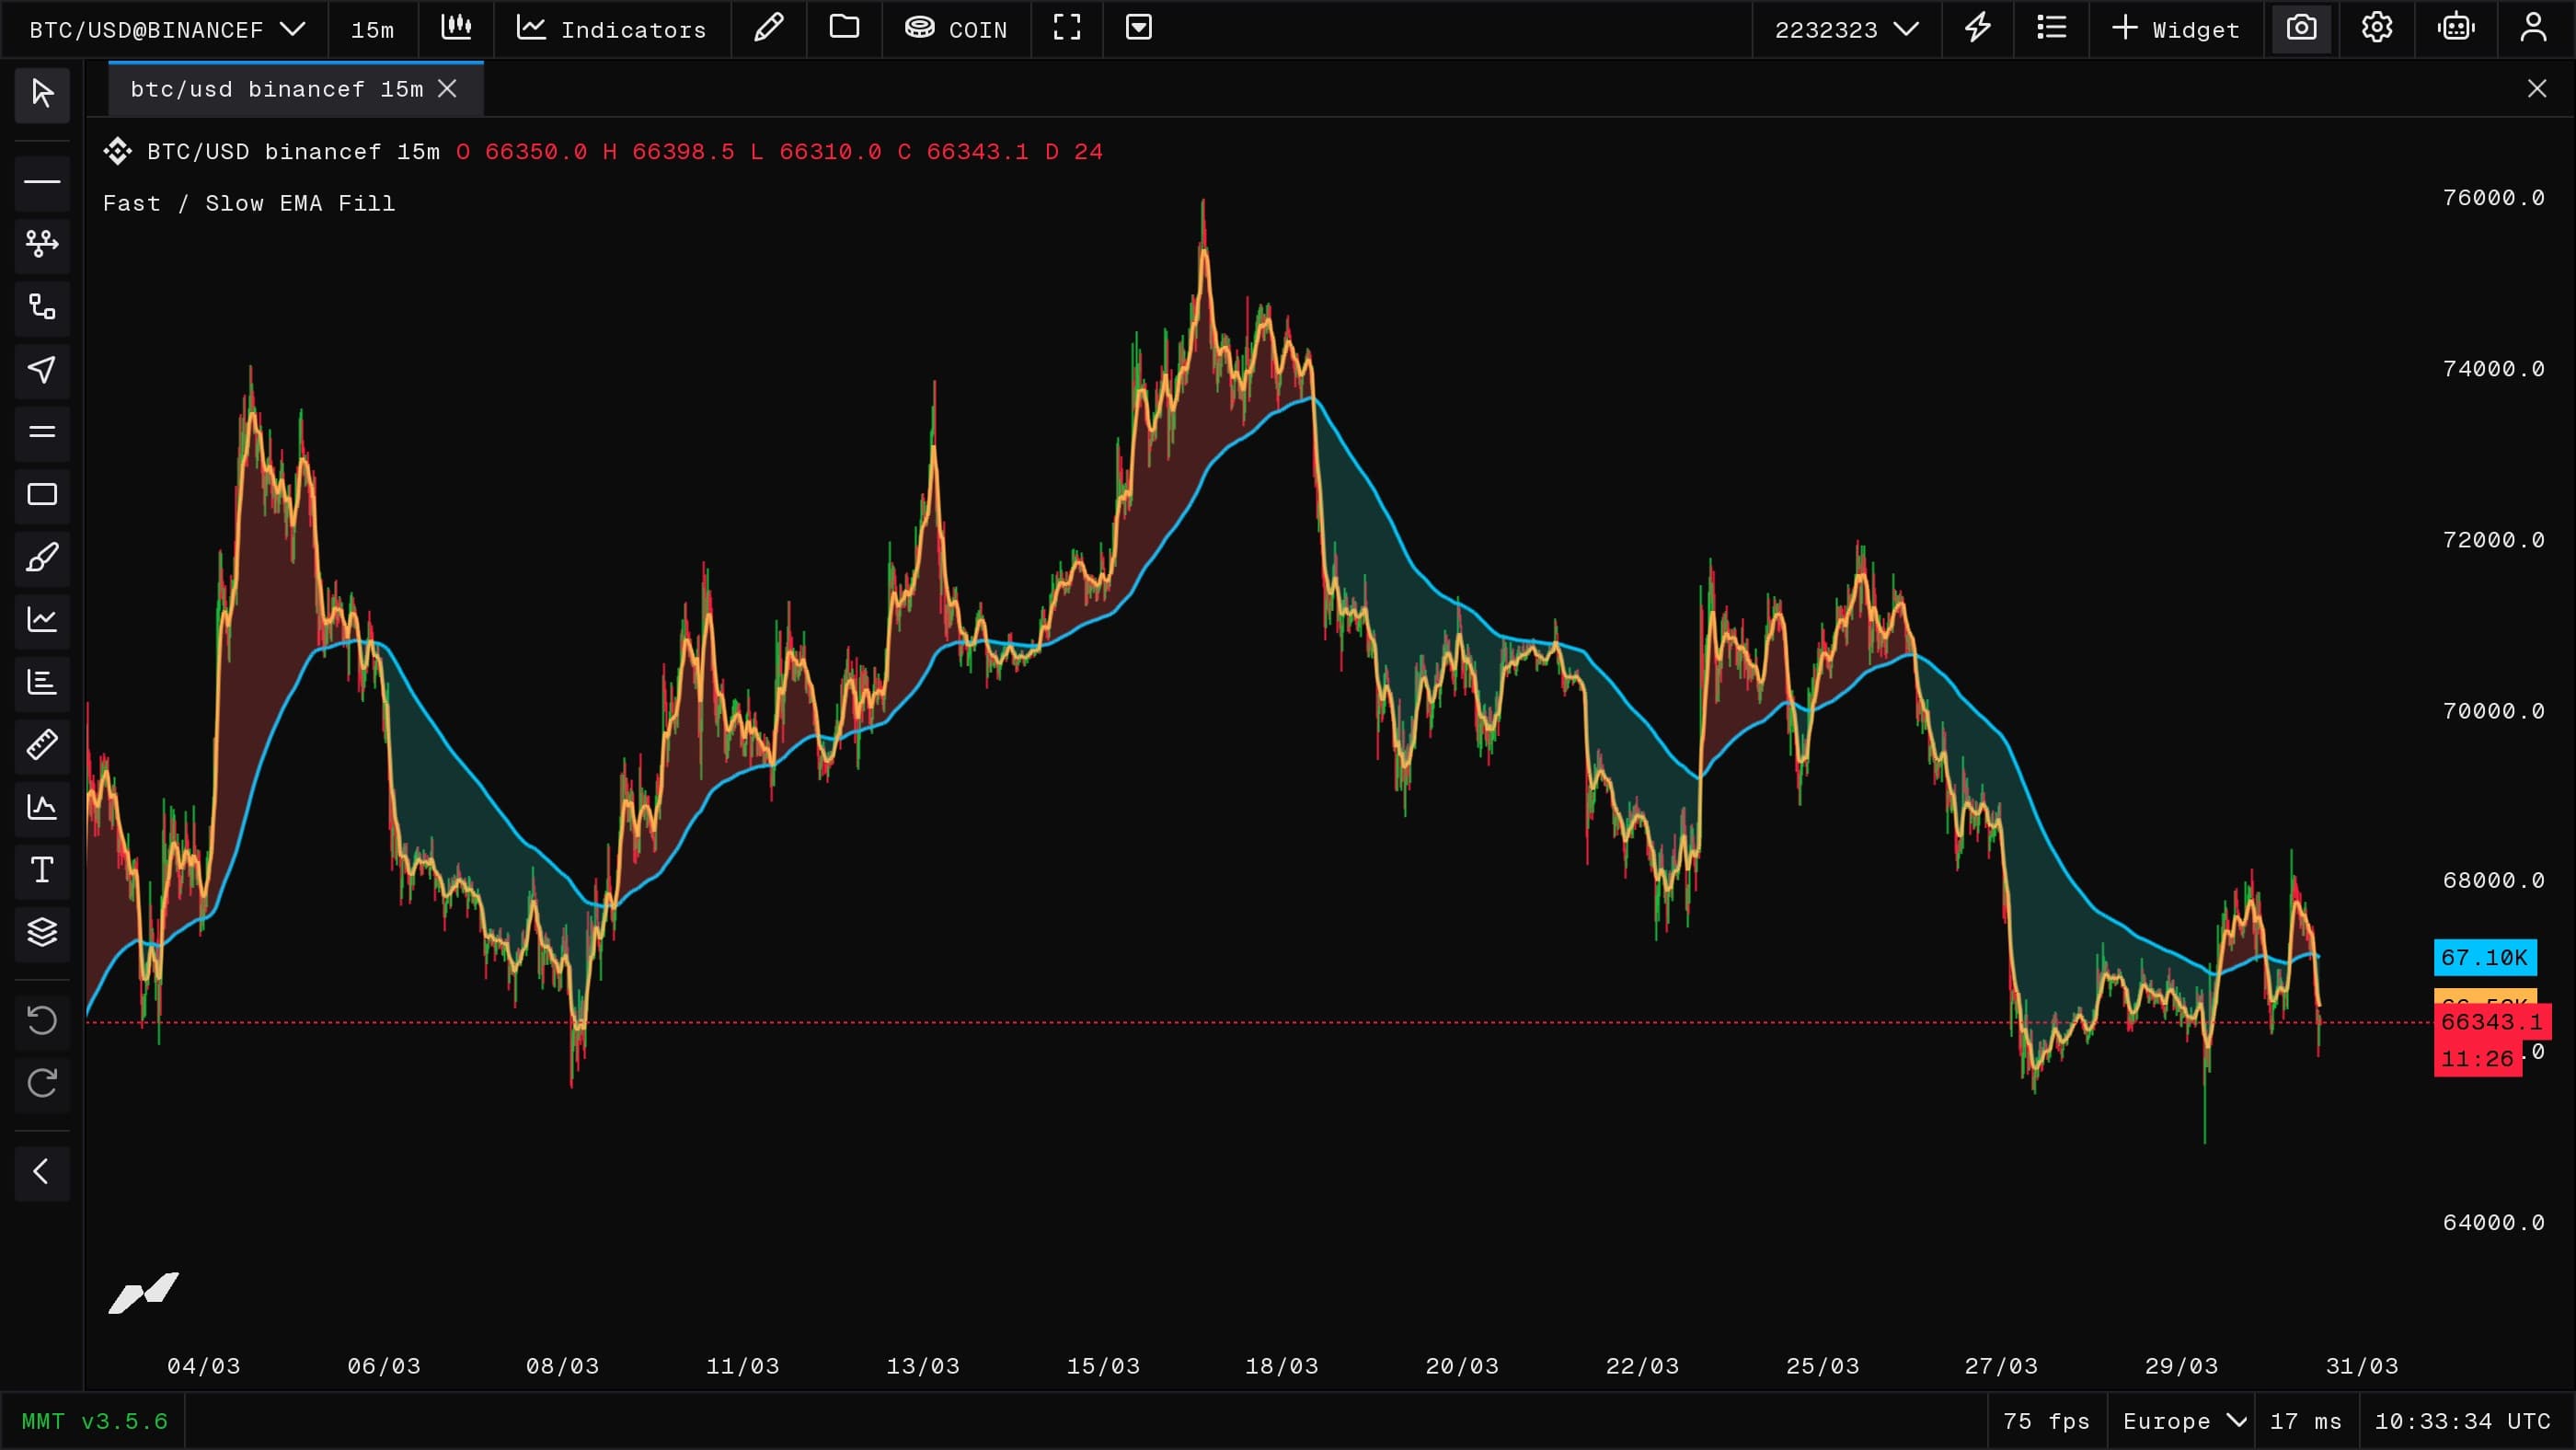
//@version=2
indicator("Fast / Slow EMA Fill", true);

const src = subscribe(data.OHLCV);

const fastLen = input.int("Fast EMA", 21, { min: 1, max: 50 });
const slowLen = input.int("Slow EMA", 55, { min: 1, max: 120, sameLine: true });

const upColor = input.color("Bull Fill", "#26a69a");
const downColor = input.color("Bear Fill", "#ef5350", { sameLine: true });

const fastColor = input.color("Fast Line", "#00c2ff");
const slowColor = input.color("Slow Line", "#ffb74d", { sameLine: true });

function onBar() {
  const fast = ta.ema(src.close(), fastLen);
  const slow = ta.ema(src.close(), slowLen);

  const pFast = plot("Fast EMA", fast, {
    color: fastColor,
    width: 2,
    forceOverlay: true
  });

  const pSlow = plot("Slow EMA", slow, {
    color: slowColor,
    width: 2,
    forceOverlay: true
  });

  fill(pFast, pSlow, {
    color:
      fast >= slow ? color.transp(upColor, 75) : color.transp(downColor, 75),
    forceOverlay: true
  });
}
EMA Cross Alert
Defines an alert that fires when the fast EMA crosses above the slow EMA.
//@version=2
indicator("EMA Cross Alert", true);

const candles = subscribe(data.OHLCV);
const fastLen = input.int("Fast EMA", 21, { min: 1 });
const slowLen = input.int("Slow EMA", 55, { min: 1, sameLine: true });

const crossUp = alert.define("ema.cross.up", {
  title: "EMA Cross Up",
  description: "Fast EMA crossed above slow EMA",
  fields: [
    { key: "price", type: "number" },
    { key: "fast", type: "number" },
    { key: "slow", type: "number" }
  ]
});

function onBar() {
  const close = candles.close();
  const fast = ta.ema(close, fastLen);
  const slow = ta.ema(close, slowLen);

  plot("Fast EMA", fast, { color: color.blue, forceOverlay: true });
  plot("Slow EMA", slow, { color: color.orange, forceOverlay: true });

  if (ta.crossover(fast, slow)) {
    crossUp.trigger({ price: close, fast, slow });
  }
}
RSI
A full-featured RSI with tabbed inputs, gradient fills that intensify as RSI moves toward overbought/oversold levels, and dashed threshold lines. Uses input.tab and input.group to organize settings across two tabs (Levels and Style), and pairs invisible helper plots with fill() to create the gradient regions above and below the midline.
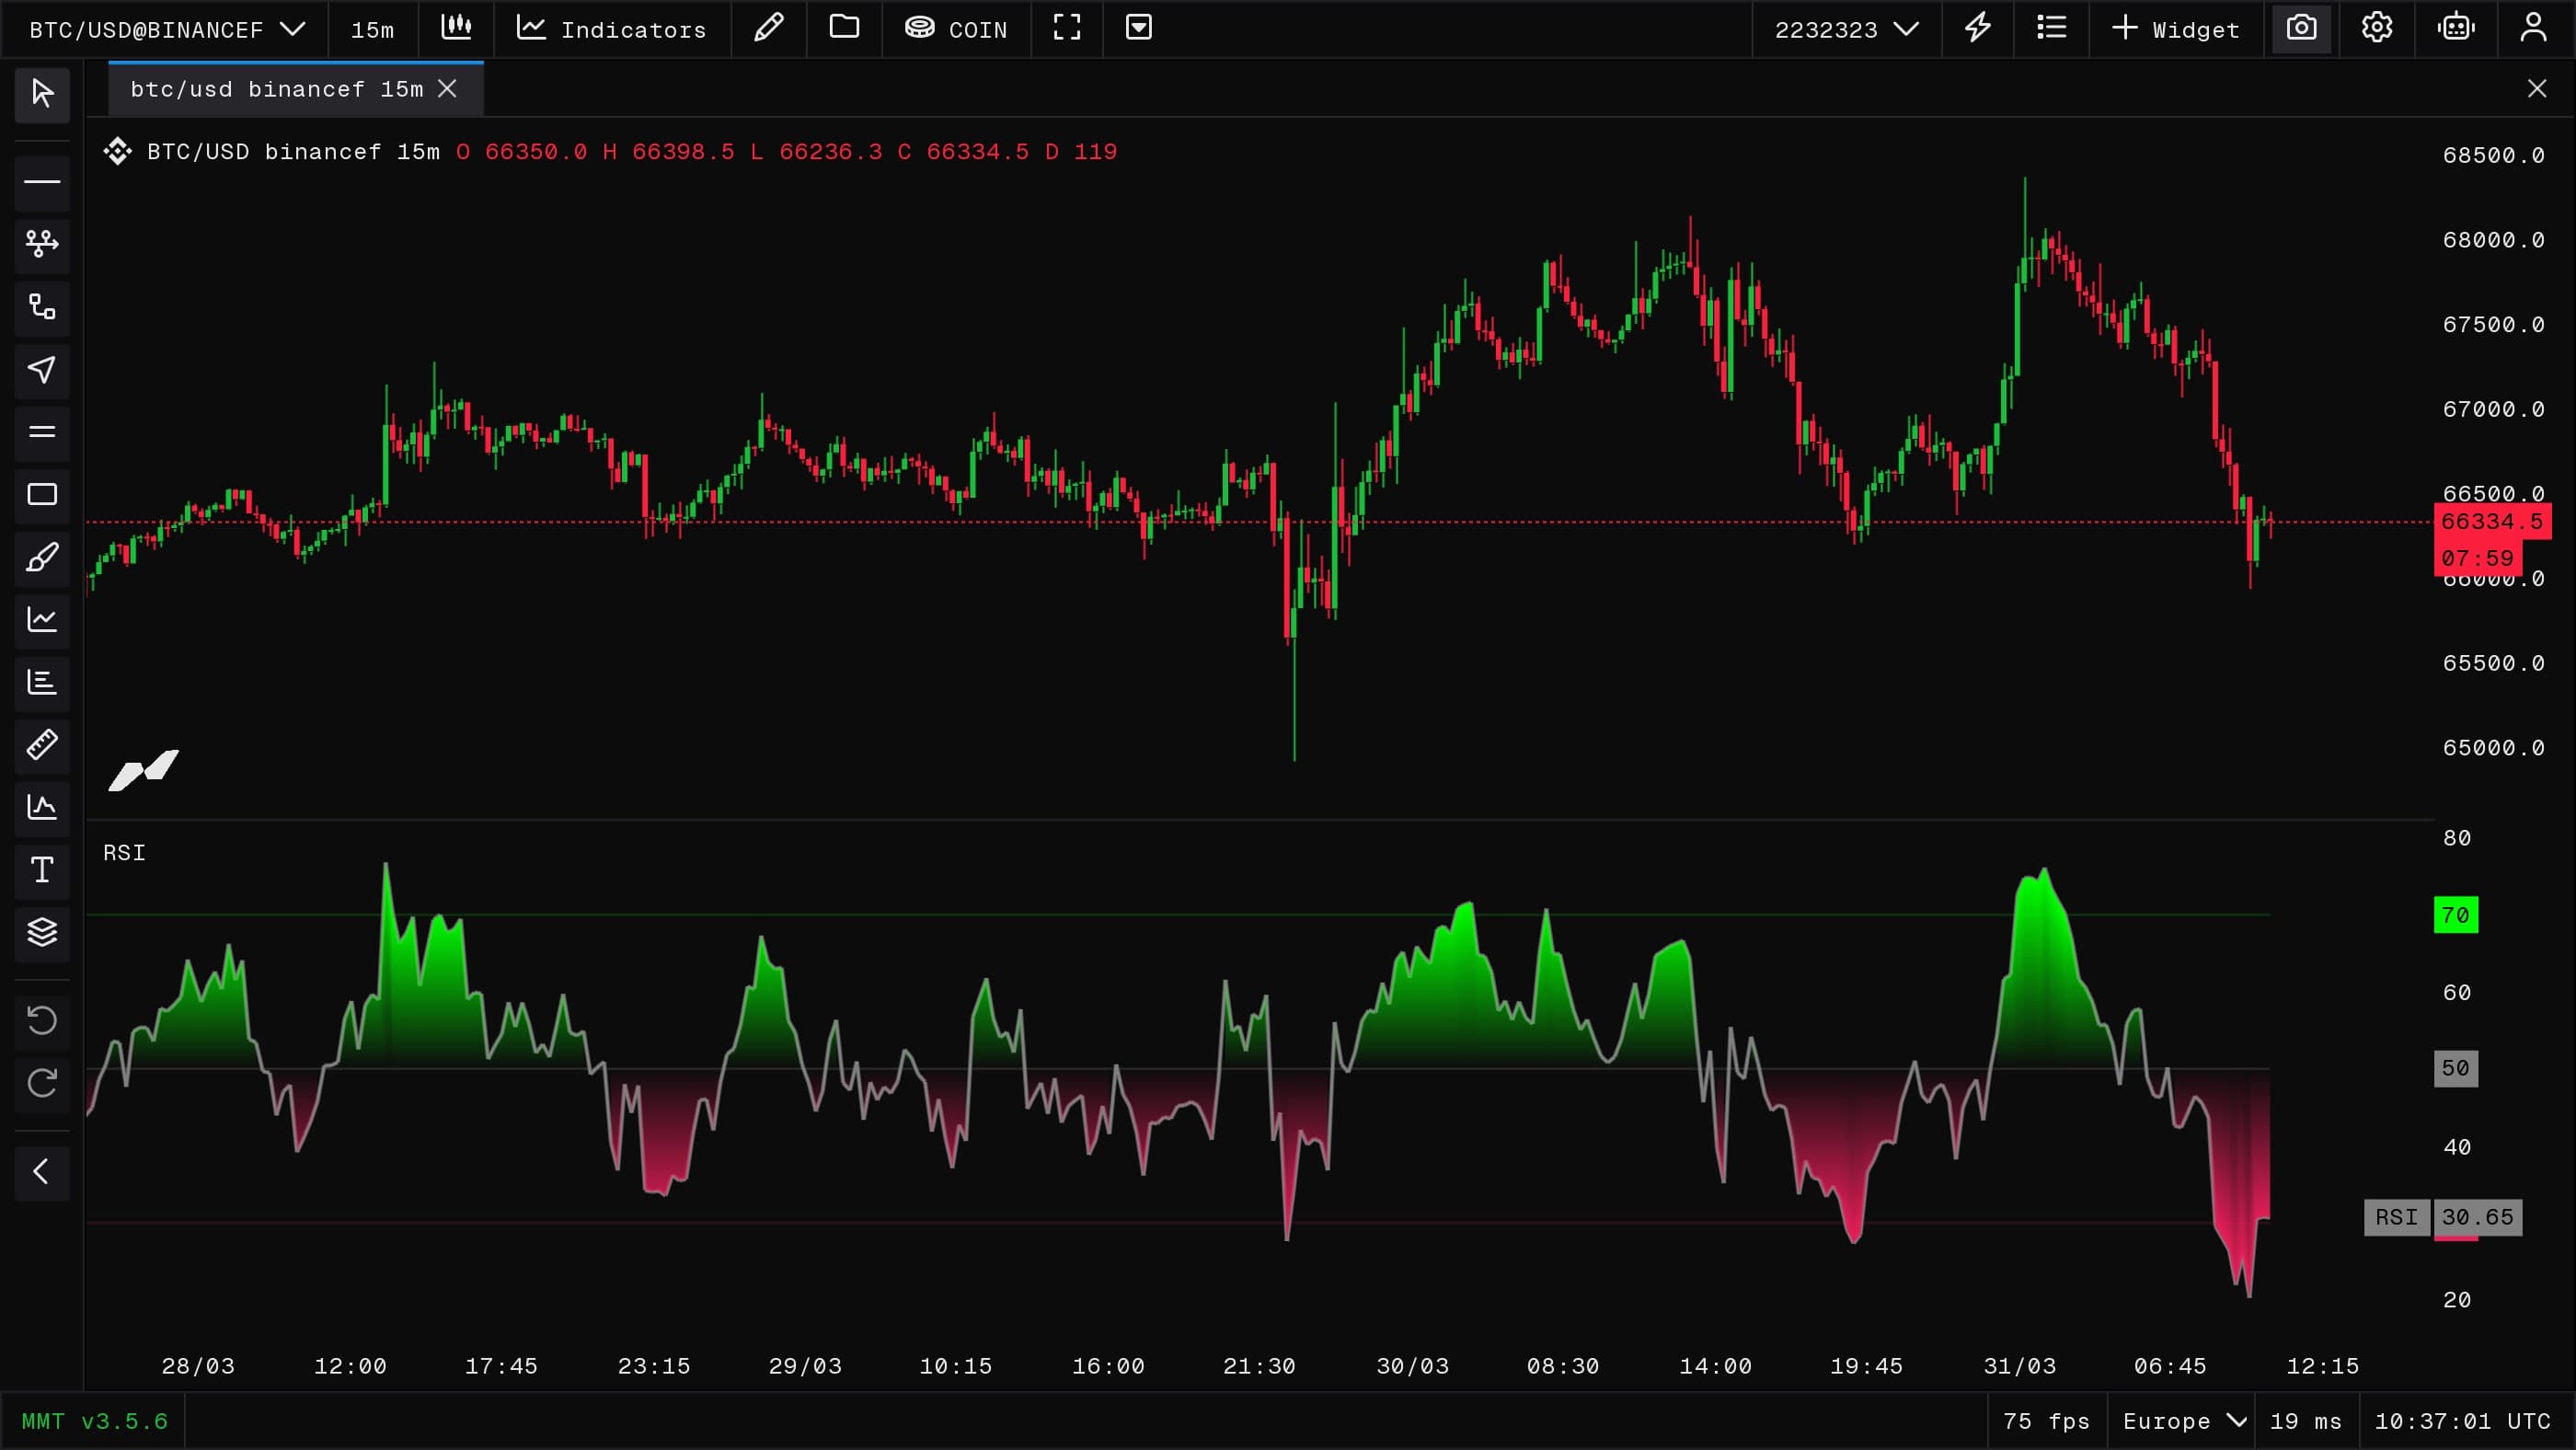
//@version=2
indicator("RSI", false);

const candles = subscribe(data.OHLCV);

// Levels tab
input.tab("Levels", { key: "tab_levels" });

input.group("RSI Settings", {
  key: "grp_rsi",
  collapsible: true,
  collapsed: false
});
const rsiLength = input.int("RSI Length", 14, {
  key: "rsiLength",
  min: 1
});

input.group("Level Settings", {
  key: "grp_levels",
  collapsible: true,
  collapsed: false
});
const upper = input.float("Upper", 70, {
  key: "upper",
  min: 0,
  max: 100
});
const upperColor = input.color("Color", color.transp(color.green, 80), {
  key: "upperColor",
  sameLine: true
});

const mid = input.float("Mid", 50, {
  key: "mid",
  min: 0,
  max: 100
});
const midColor = input.color("Color", color.transp(color.gray, 70), {
  key: "midColor",
  sameLine: true
});

const lower = input.float("Lower", 30, {
  key: "lower",
  min: 0,
  max: 100
});
const lowerColor = input.color("Color", color.transp(color.red, 80), {
  key: "lowerColor",
  sameLine: true
});

// Style tab
input.tab("Style", { key: "tab_style" });

input.group("Colors", {
  key: "grp_colors",
  collapsible: true,
  collapsed: false
});
const bullFillColor = input.color("Bull Fill", color.green, {
  key: "bullFillColor"
});
const bearFillColor = input.color("Bear Fill", color.red, {
  key: "bearFillColor",
  sameLine: true
});
const rsiLineColor = input.color("RSI Line", color.rgb(128, 128, 128), {
  key: "rsiLineColor"
});

function onBar() {
  const rsi = ta.rsi(candles.close(), rsiLength);
  if (na(rsi)) return;

  const aboveMid = rsi >= mid ? rsi : NaN;
  const belowMid = rsi < mid ? rsi : NaN;
  const midAbove = rsi >= mid ? mid : NaN;
  const midBelow = rsi < mid ? mid : NaN;

  plot("Upper", upper, {
    color: upperColor,
    style: linestyle.dashed
  });

  plot("Lower", lower, {
    color: lowerColor,
    style: linestyle.dashed
  });

  plot("Mid", mid, {
    color: midColor,
    width: 1
  });

  plot("RSI", rsi, {
    color: rsiLineColor,
    width: 2,
    showLabel: true,
    showValue: true
  });

  const abovePlot = plot("RSI Above Mid", aboveMid, {
    color: color.transp(color.white, 100),
    showLabel: false,
    showValue: false
  });

  const midAbovePlot = plot("Mid Above", midAbove, {
    color: color.transp(color.white, 100),
    showLabel: false,
    showValue: false
  });

  const belowPlot = plot("RSI Below Mid", belowMid, {
    color: color.transp(color.white, 100),
    showLabel: false,
    showValue: false
  });

  const midBelowPlot = plot("Mid Below", midBelow, {
    color: color.transp(color.white, 100),
    showLabel: false,
    showValue: false
  });

  fill(abovePlot, midAbovePlot, {
    topValue: upper,
    bottomValue: mid,
    topColor: color.transp(bullFillColor, 0),
    bottomColor: color.transp(bullFillColor, 100)
  });

  fill(midBelowPlot, belowPlot, {
    topValue: mid,
    bottomValue: lower,
    topColor: color.transp(bearFillColor, 100),
    bottomColor: color.transp(bearFillColor, 0)
  });
}