

Examples
CVD & Volume Delta
Examples using cumulative volume delta and volume delta data with bucket filtering.
Basic CVD Plot
Subscribe to data.CVD and plot the close as a line.
//@version=2
indicator("CVD", false);
const cvd = subscribe(data.CVD, { bucket: 1 });

function onBar() {
  plot("CVD", cvd.close(), { color: color.orange });
}
Bucketed CVD — Small / Mid / Whale
Splits CVD into three trade-size tiers and plots each as its own candle series. This lets you see which participant class is driving net buying or selling pressure.
| Tier | Dollar Range | Buckets |
|---|---|---|
| Small | <$25K | 2, 3, 4 |
| Mid | $25K–$500K | 5, 6, 7, 8 |
| Whale | $500K+ | 9, 10, 11 |
Why skip bucket 1?
Bucket 1 is the "all trades" bucket. This script uses the granular buckets (2–11) to separate by size, so bucket 1 is not needed.
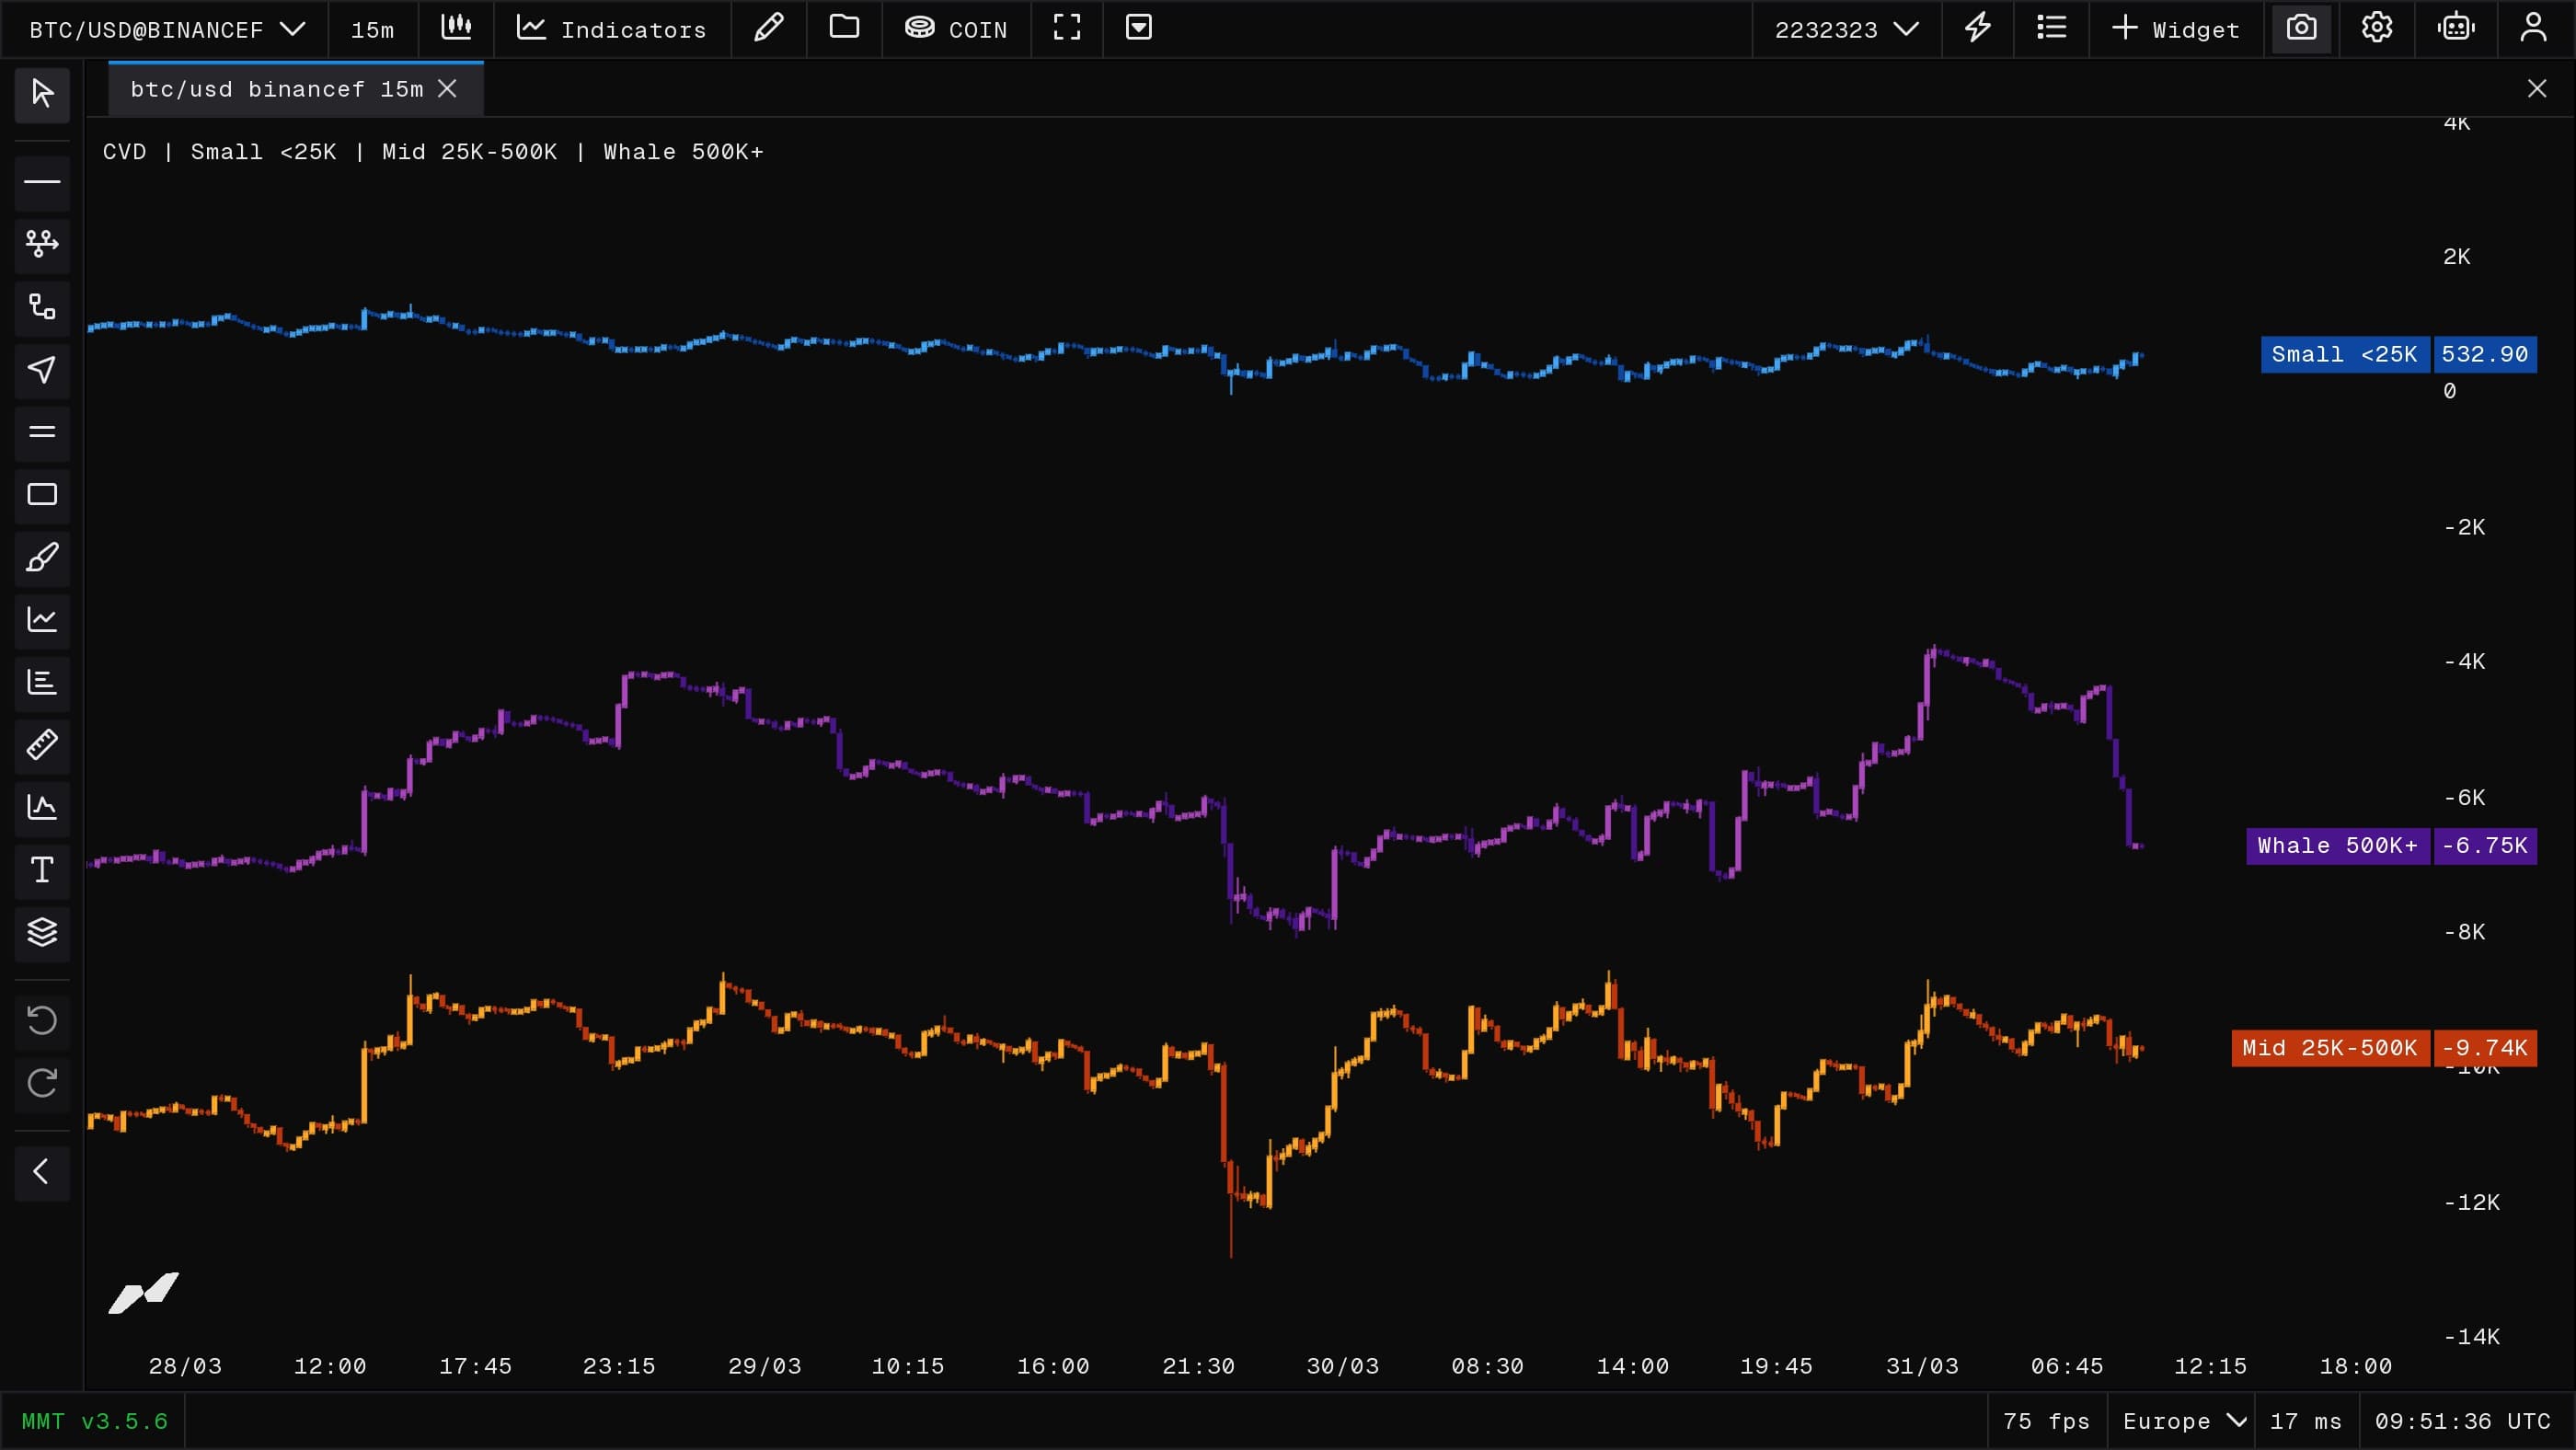
//@version=2
indicator("CVD | Small <25K | Mid 25K-500K | Whale 500K+", false);

// Color inputs
const smallBull = input.color("Small Bull", "#42a5f7");
const smallBear = input.color("Small Bear", "#0d47a1", { sameLine: true });

const midBull = input.color("Mid Bull", "#ffa726");
const midBear = input.color("Mid Bear", "#bf360c", { sameLine: true });

const whaleBull = input.color("Whale Bull", "#ab47bc");
const whaleBear = input.color("Whale Bear", "#4a148c", { sameLine: true });

// Small: <$25K (buckets 2-4)
const s1 = subscribe(data.CVD, { bucket: 2 });
const s2 = subscribe(data.CVD, { bucket: 3 });
const s3 = subscribe(data.CVD, { bucket: 4 });

// Mid: $25K–$500K (buckets 5-8)
const m1 = subscribe(data.CVD, { bucket: 5 });
const m2 = subscribe(data.CVD, { bucket: 6 });
const m3 = subscribe(data.CVD, { bucket: 7 });
const m4 = subscribe(data.CVD, { bucket: 8 });

// Whale: $500K+ (buckets 9-11)
const w1 = subscribe(data.CVD, { bucket: 9 });
const w2 = subscribe(data.CVD, { bucket: 10 });
const w3 = subscribe(data.CVD, { bucket: 11 });

function onBar(index) {
  const sO = s1.open() + s2.open() + s3.open();
  const sH = s1.high() + s2.high() + s3.high();
  const sL = s1.low() + s2.low() + s3.low();
  const sC = s1.close() + s2.close() + s3.close();

  const mO = m1.open() + m2.open() + m3.open() + m4.open();
  const mH = m1.high() + m2.high() + m3.high() + m4.high();
  const mL = m1.low() + m2.low() + m3.low() + m4.low();
  const mC = m1.close() + m2.close() + m3.close() + m4.close();

  const wO = w1.open() + w2.open() + w3.open();
  const wH = w1.high() + w2.high() + w3.high();
  const wL = w1.low() + w2.low() + w3.low();
  const wC = w1.close() + w2.close() + w3.close();

  const sColor = sC >= sO ? smallBull : smallBear;
  const mColor = mC >= mO ? midBull : midBear;
  const wColor = wC >= wO ? whaleBull : whaleBear;

  plotCandle("Small <25K", sO, sH, sL, sC, {
    bodyColor: sColor,
    wickColor: sColor,
    borderColor: sColor
  });

  plotCandle("Mid 25K-500K", mO, mH, mL, mC, {
    bodyColor: mColor,
    wickColor: mColor,
    borderColor: mColor
  });

  plotCandle("Whale 500K+", wO, wH, wL, wC, {
    bodyColor: wColor,
    wickColor: wColor,
    borderColor: wColor
  });
}