

Examples
Book Data
Examples using order book data — imbalance, depth, and bid/ask analysis.
Book Imbalance with Color Scale
Measures bid/ask imbalance within a configurable depth percentage and colors a histogram using color.scale. Combines book data, select inputs, and gradient coloring.
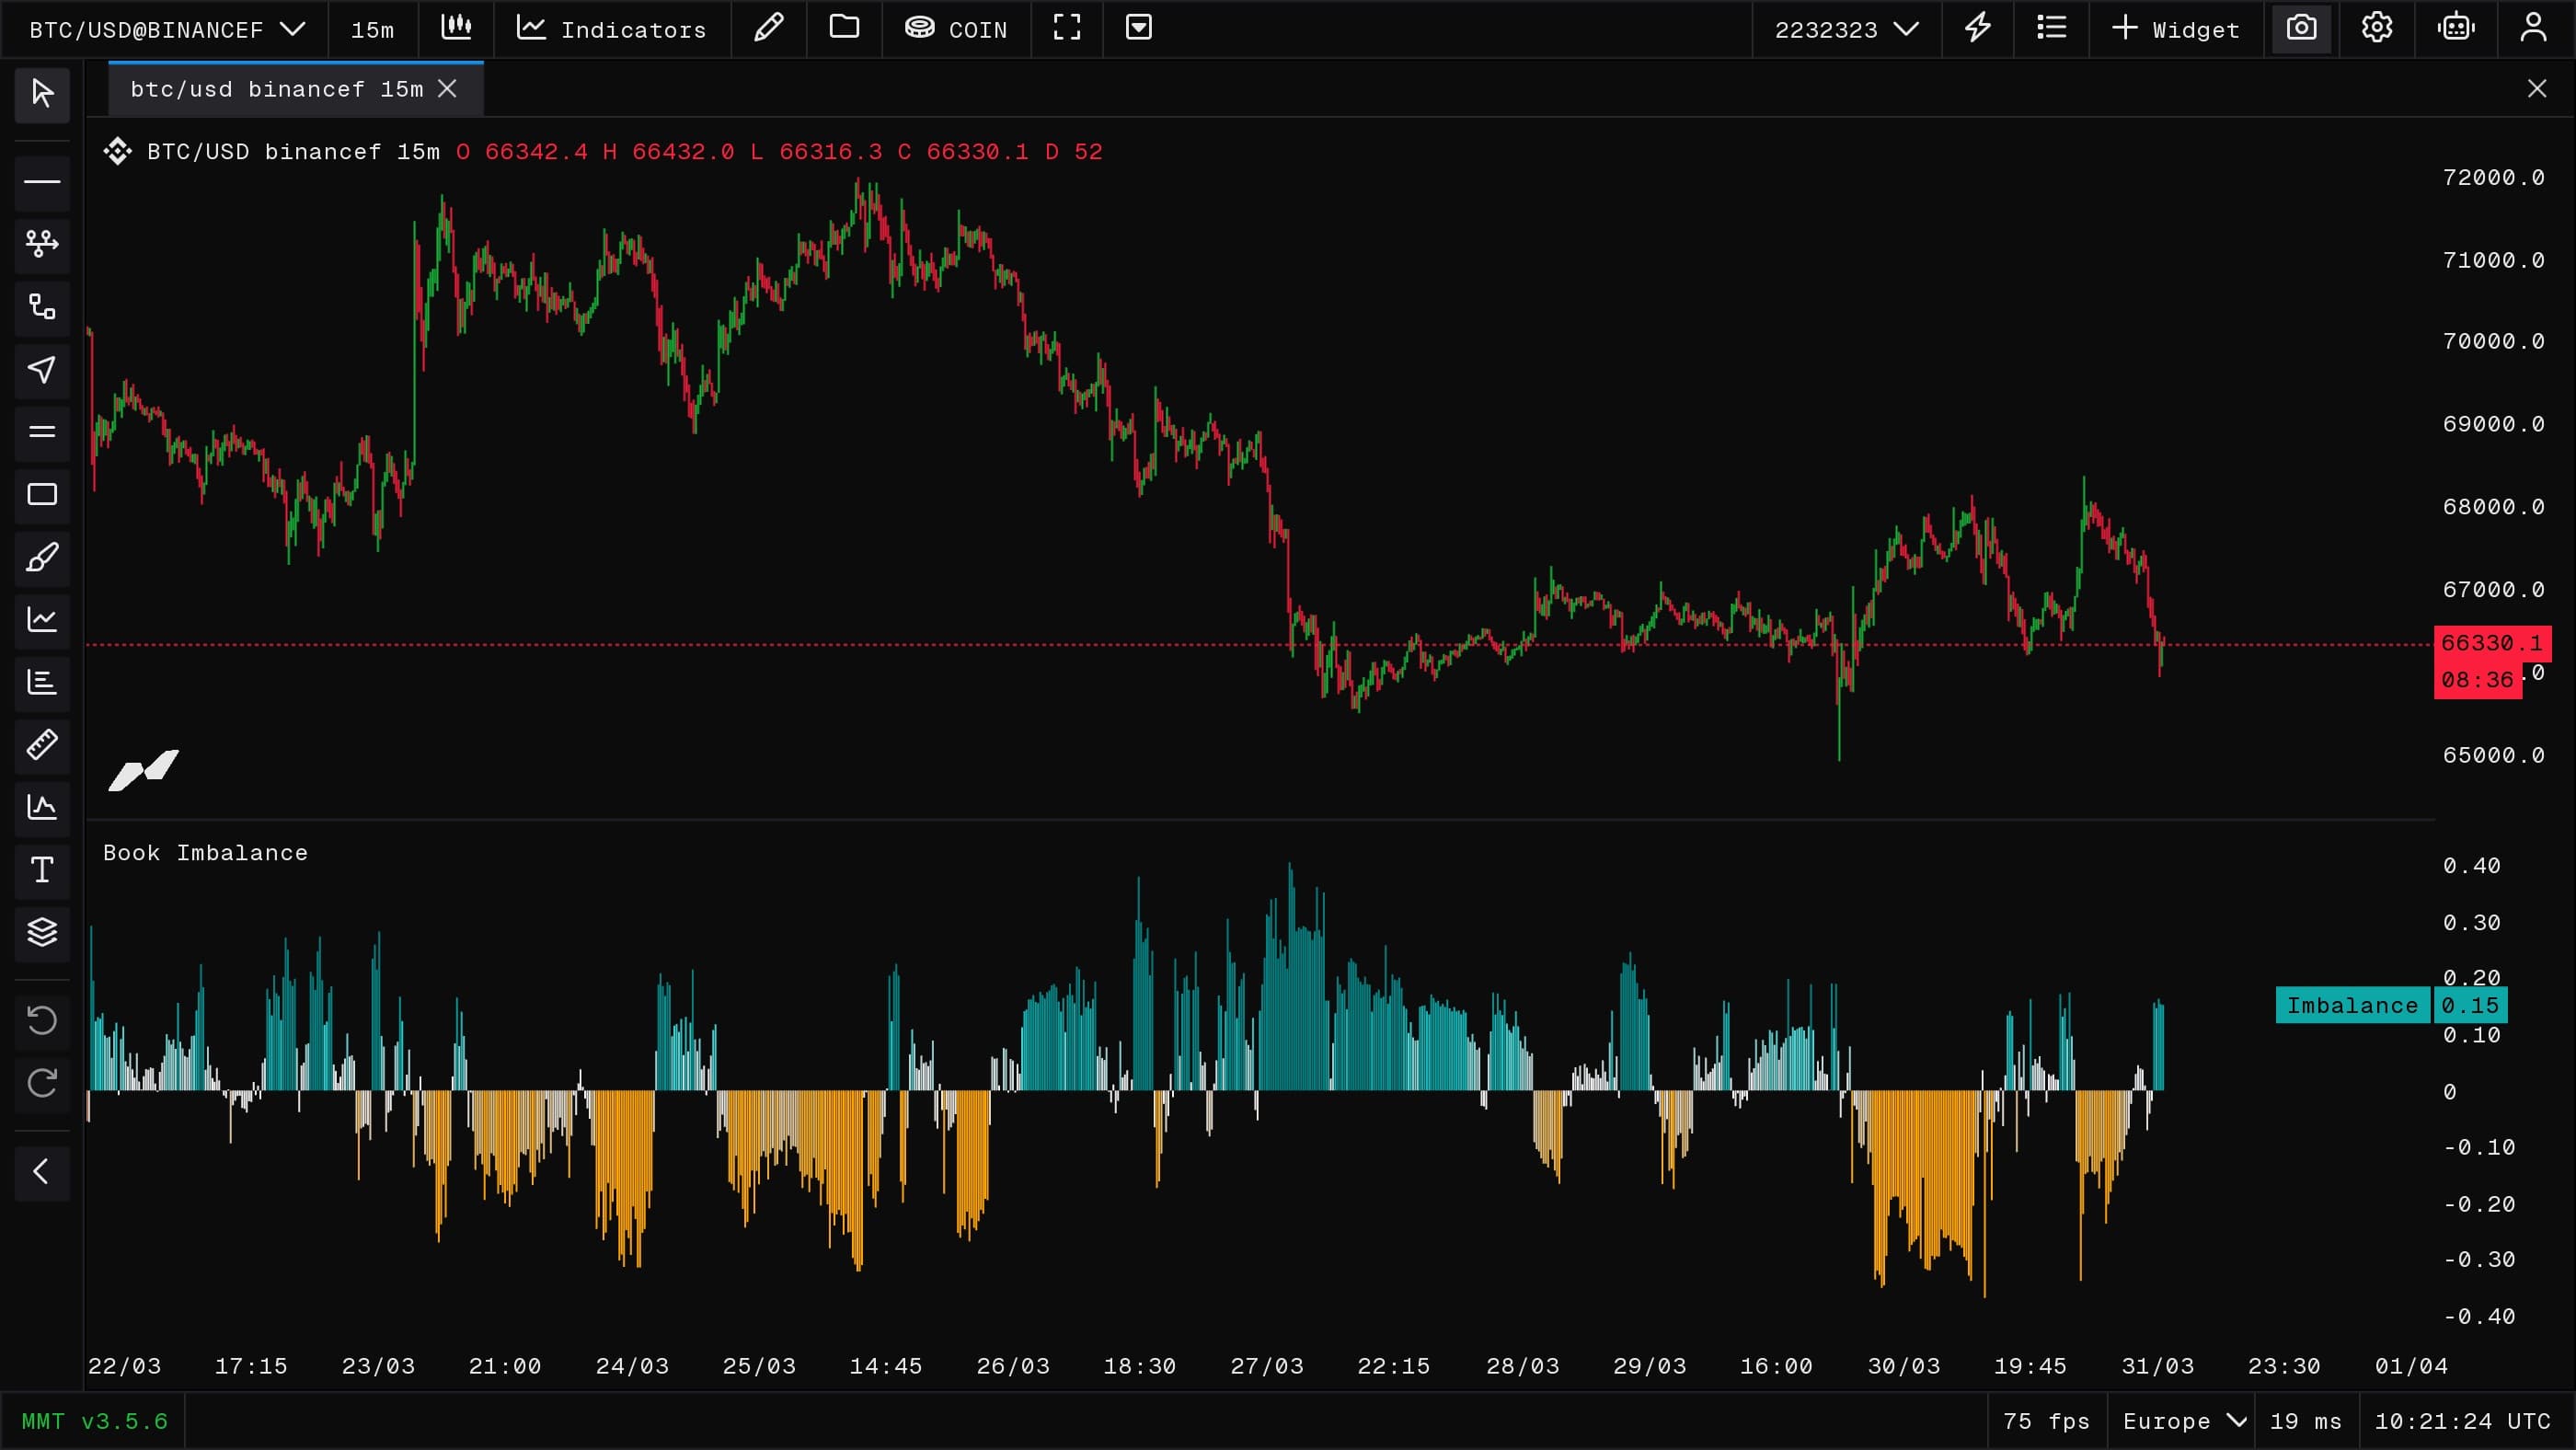
//@version=2
indicator("Book Imbalance", false);
const book = subscribe(data.BOOK);

const upc = input.color("up", color.teal);
const doc = input.color("down", color.orange, { sameLine: true });

const depthPct = input.select("Depth %", 2, {
  selectables: ["0.25", "0.5", "1.0", "1.5", "2.0", "3.0", "5.0"]
});

const scaleMaxSel = input.select("Color Range", 0, {
  selectables: ["0.2", "0.4", "0.6", "0.8", "1.0"]
});

let scaleMax = 0.4;
if (scaleMaxSel === "0.2") scaleMax = 0.2;
else if (scaleMaxSel === "0.4") scaleMax = 0.4;
else if (scaleMaxSel === "0.6") scaleMax = 0.6;
else if (scaleMaxSel === "0.8") scaleMax = 0.8;
else if (scaleMaxSel === "1.0") scaleMax = 1.0;

const neutral = color.rgb(245, 245, 245);

const imbalanceScale = color.scale(
  [
    [-scaleMax, doc],
    [0, neutral],
    [scaleMax, upc]
  ],
  {
    space: color.space.hsl,
    easing: color.easing.smoothstep
  }
);

function onBar() {
  const mid = book.mid();
  if (!(mid > 0)) return;

  const imbalance = book.imbalance(mid, Number(depthPct), {
    innerPct: 0.5,
    mode: "differential",
    unit: "quote"
  });
  if (!imbalance) return;

  plotHistogram("Imbalance", imbalance.ratio, {
    color: imbalanceScale.sample(imbalance.ratio)
  });
}