

Examples
Colors & Gradients
Examples using color.scale, color.rgb, gradients, and dynamic coloring techniques.
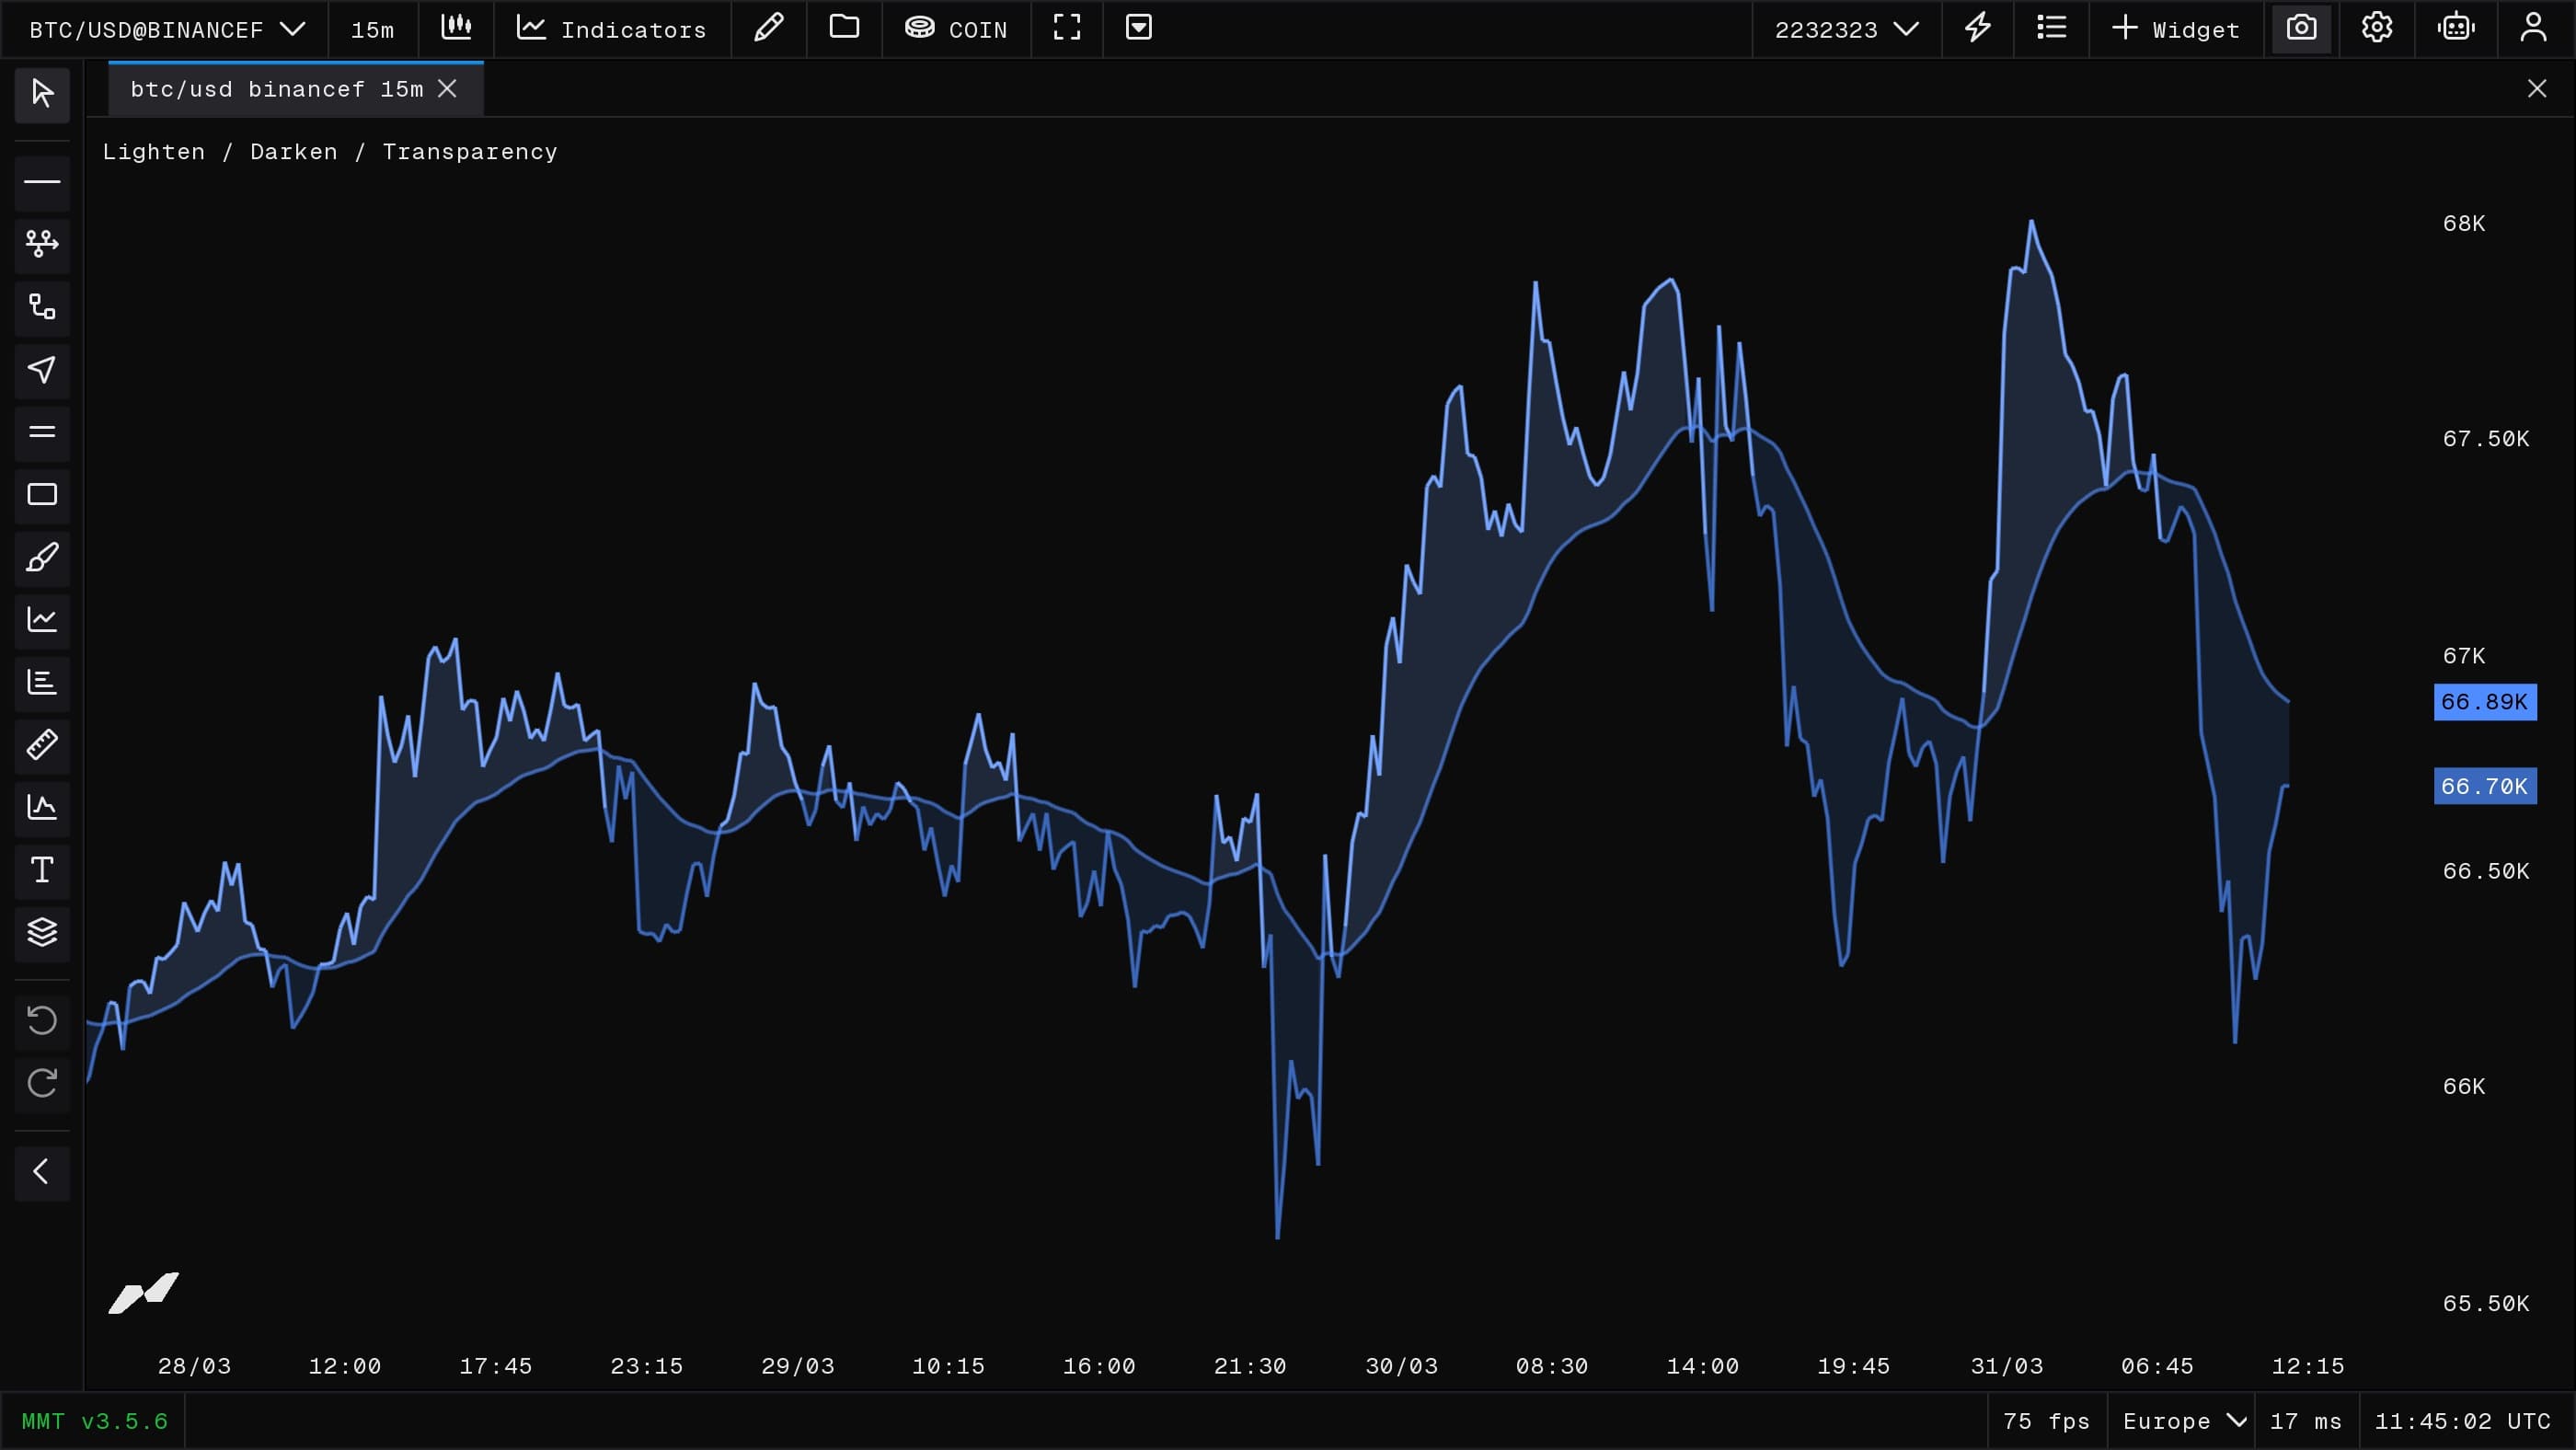
Lighten, Darken and Transparency
Use one accent color, then derive the stronger and softer variants directly in the script. This keeps the palette cohesive while still giving you clear bull/bear separation.
//@version=2
indicator("Lighten / Darken / Transparency", false);

const candles = subscribe(data.OHLCV);

const basisLen = input.int("EMA Length", 34, { min: 1 });
const baseColor = input.color("Accent", "#4f8cff");
const fillFade = input.int("Fill Fade", 82, {
  min: 0,
  max: 100,
  sameLine: true
});

function onBar() {
  const close = candles.close();
  const basis = ta.ema(close, basisLen);
  if (typeof basis !== "number") return;

  const above = close >= basis;
  const lineColor = above
    ? color.lighten(baseColor, 22)
    : color.darken(baseColor, 26);

  const price = plot("Close", close, {
    color: lineColor,
    width: 2
  });

  const avg = plot("EMA", basis, {
    color: color.transp(baseColor, 35),
    width: 2
  });

  fill(price, avg, {
    color: color.transp(lineColor, fillFade)
  });
}
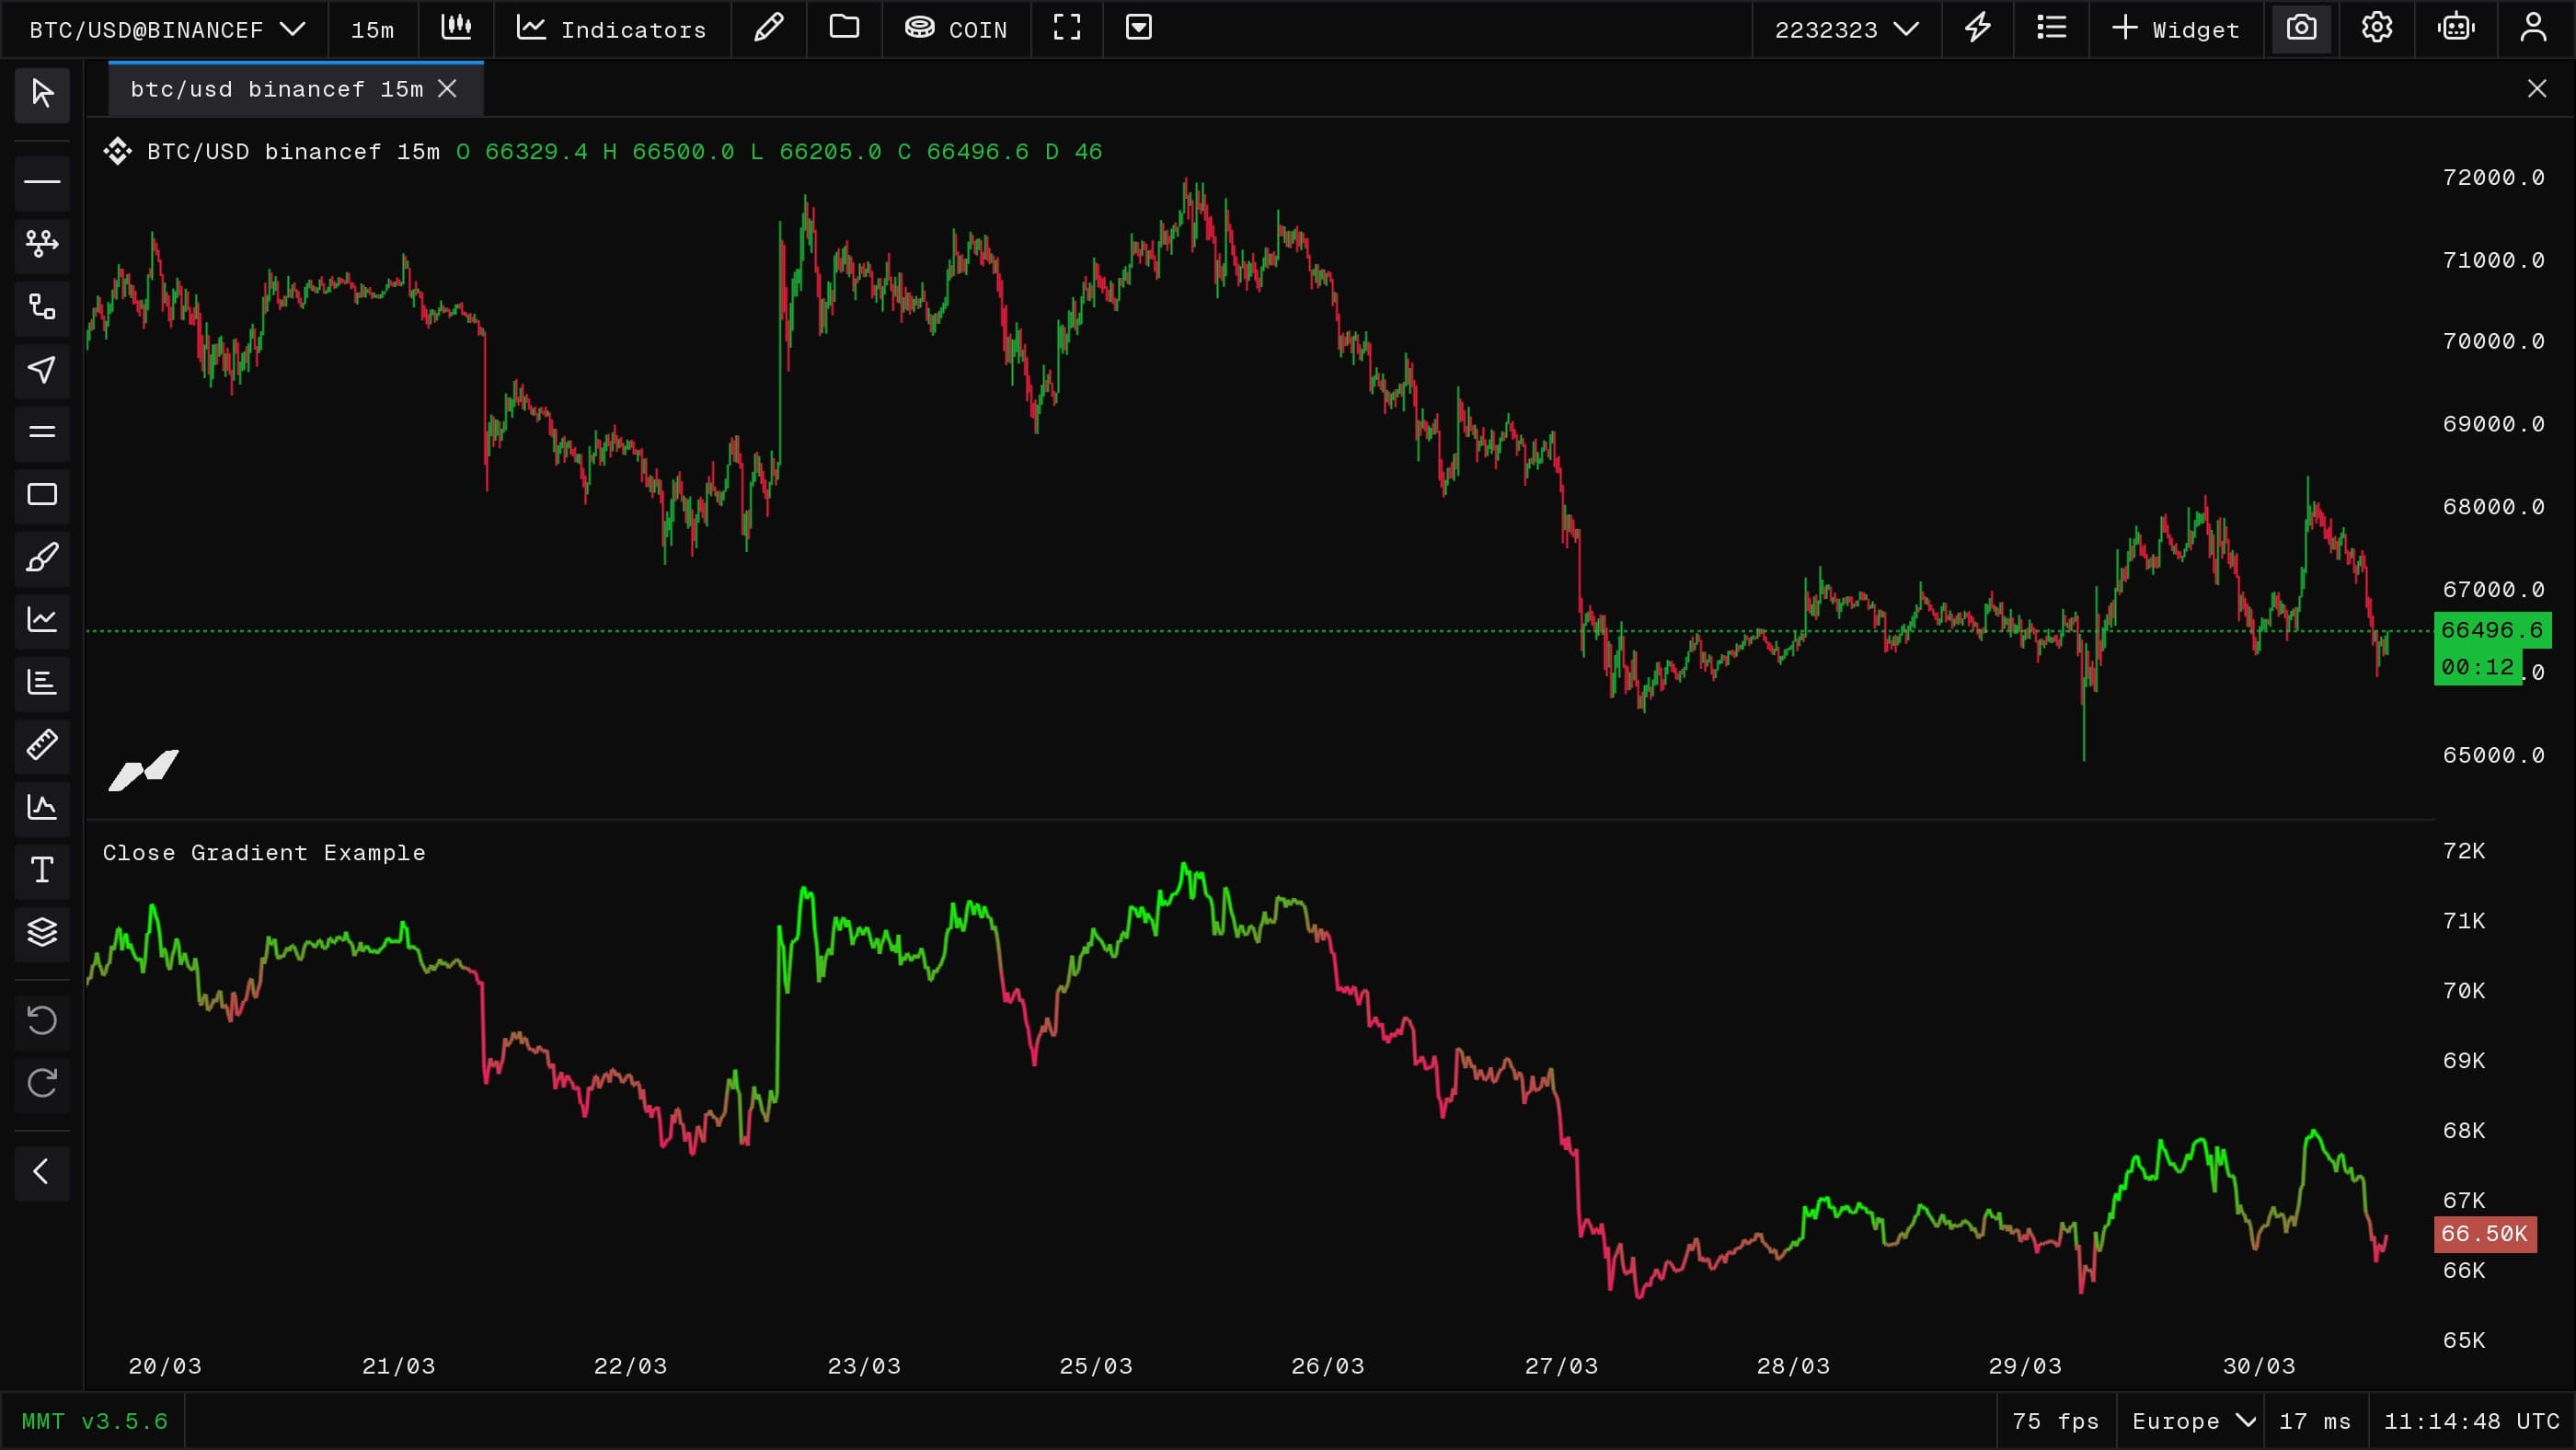
Using color.fromGradient
Map the close into a rolling range to color a single line from bearish to bullish extremes.
//@version=2
indicator("Close Gradient Example", false);

const candles = subscribe(data.OHLCV);

const lowColor = input.color("Low Color", color.red);
const highColor = input.color("High Color", color.green);

function onBar(index) {
  const price = candles.close();
  const loRaw = ta.lowest(price, 100);
  const hiRaw = ta.highest(price, 100);
  const lo = loRaw !== undefined ? loRaw : price;
  const hi = hiRaw !== undefined ? hiRaw : price;

  const gradColor = color.fromGradient(price, lo, hi, lowColor, highColor);

  plot("Close", price, { color: gradColor, width: 2 });
}
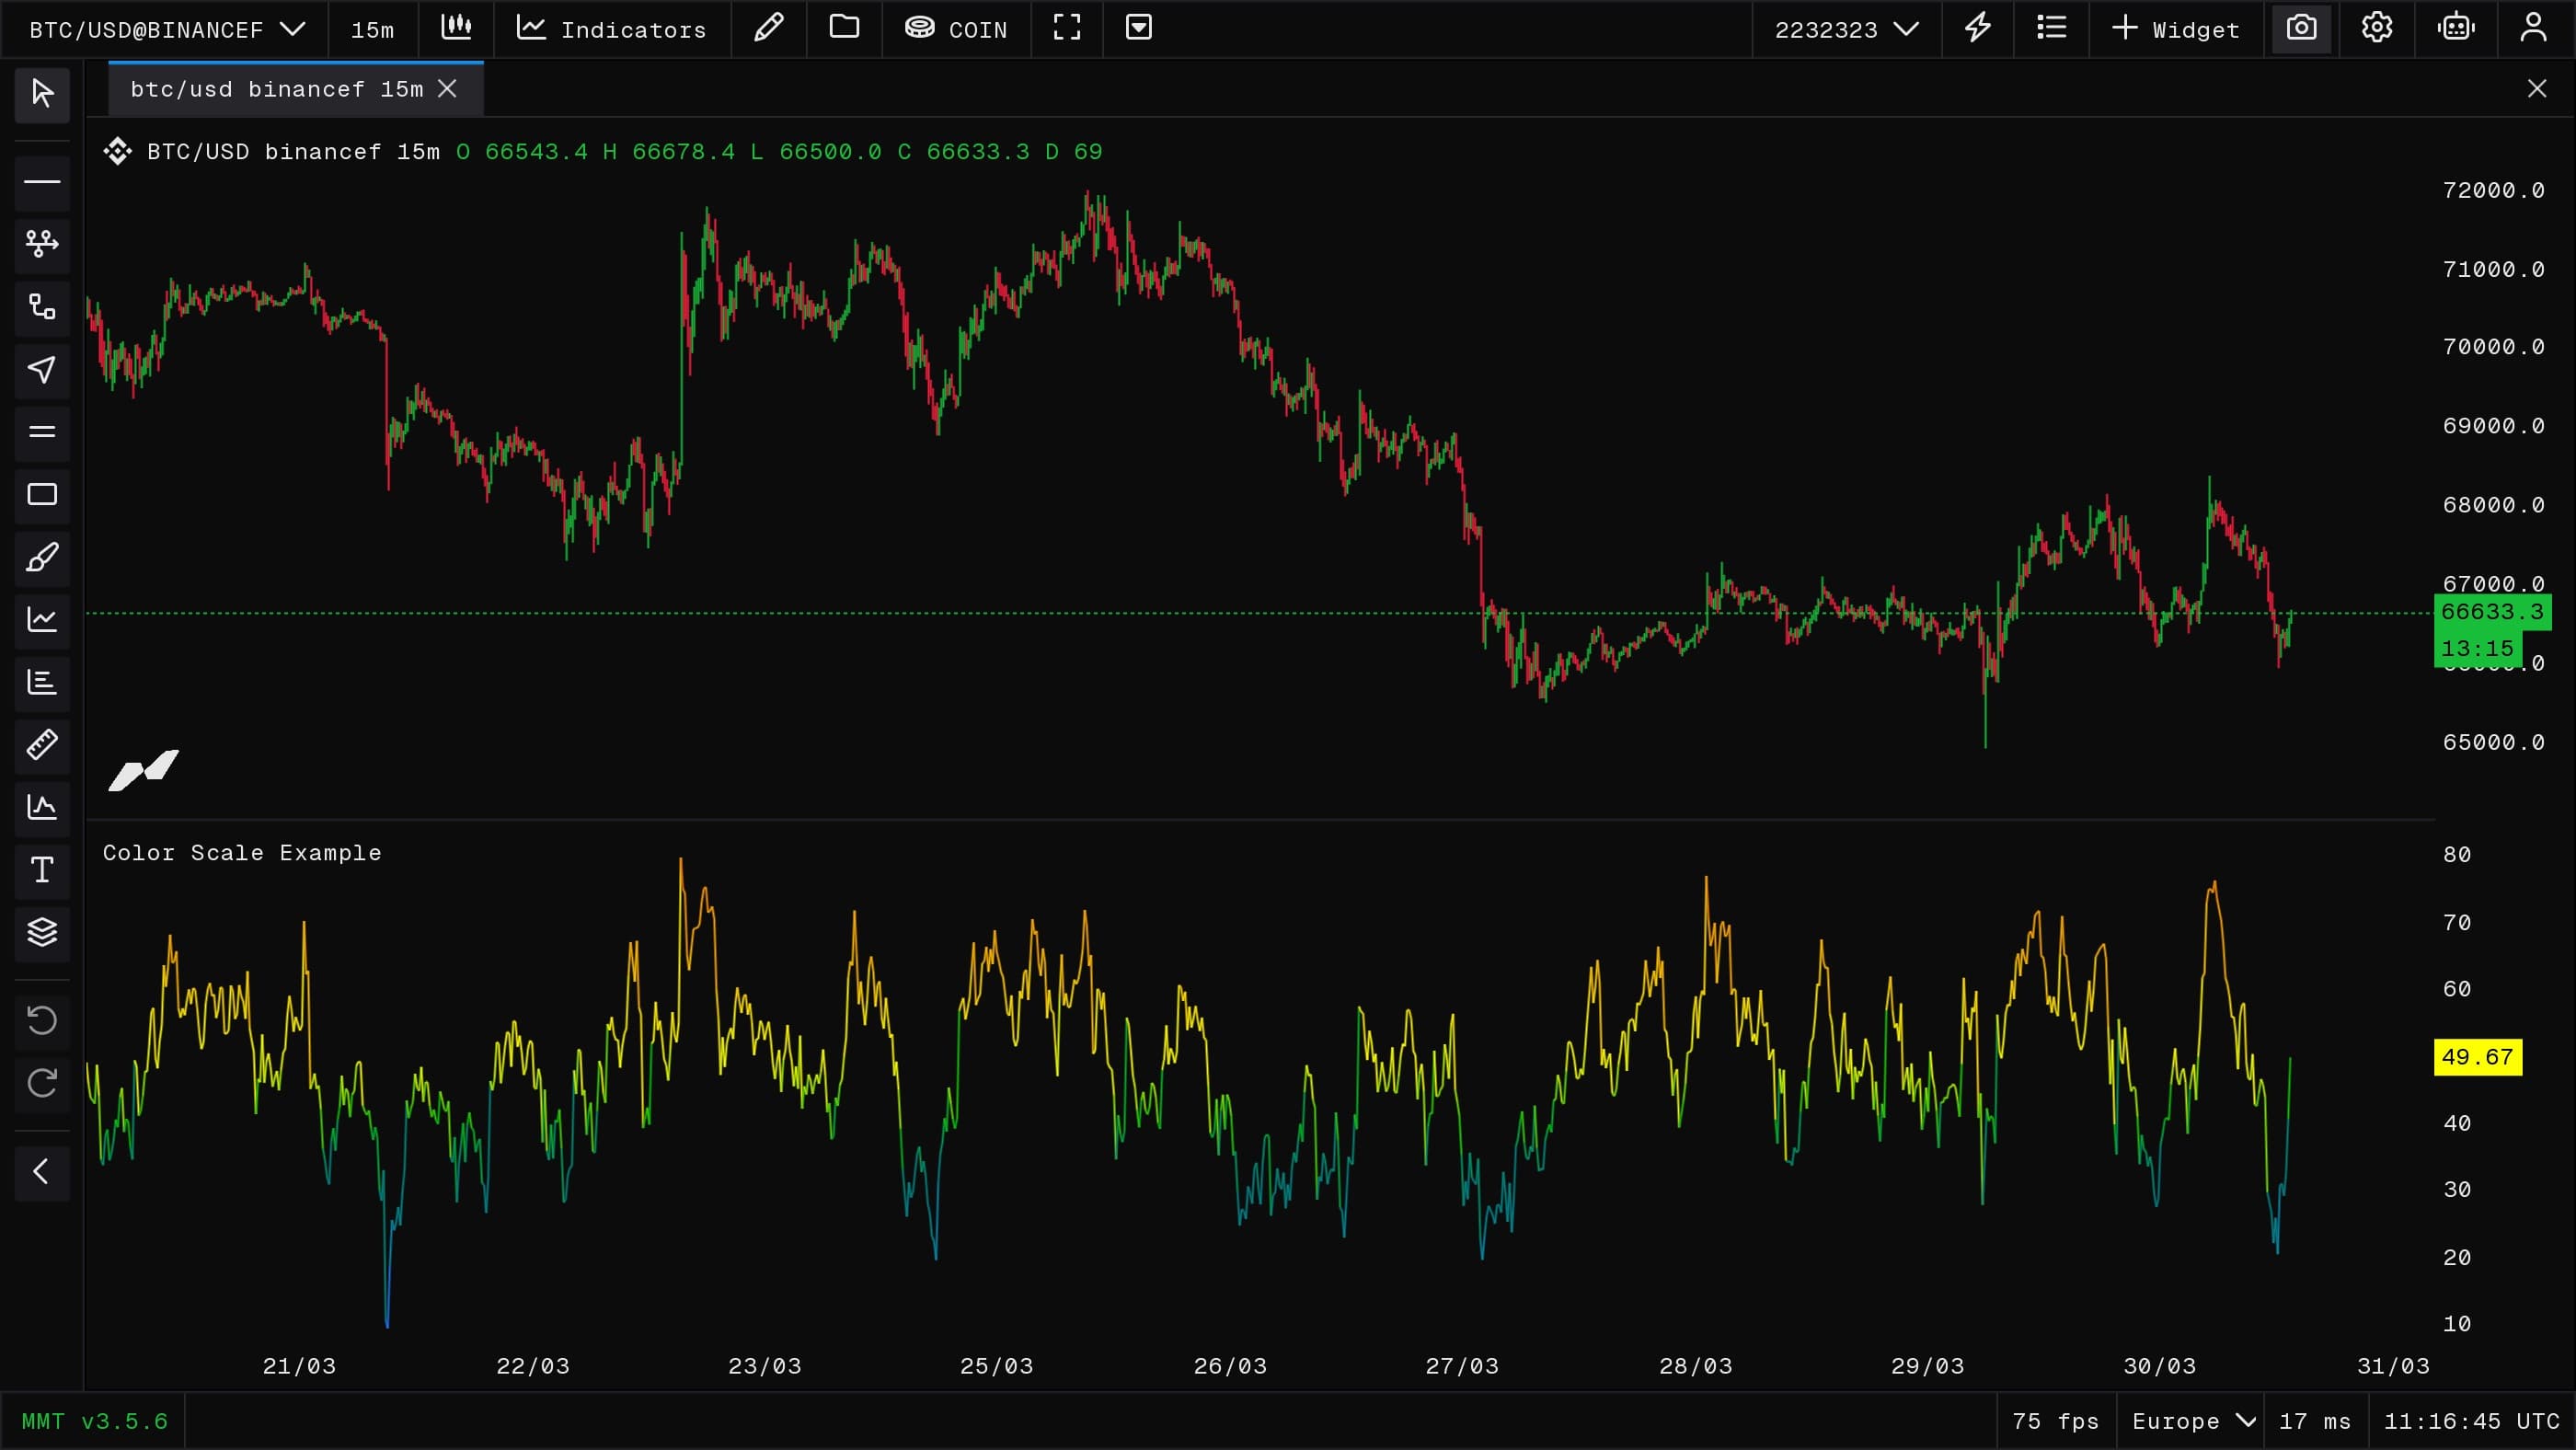
Using static color.scale
Use a static scale when you want the same value to always map to the same color.
//@version=2
indicator("Color Scale Example", false);
const candles = subscribe(data.OHLCV);

const heatScale = color.scale(
  [
    [0, color.blue],
    [30, color.teal],
    [50, color.yellow],
    [70, color.orange],
    [100, color.red]
  ],
  {
    space: color.space.hsl,
    easing: color.easing.smoothstep
  }
);

function onBar(index) {
  const rsiValue = ta.rsi(candles.close(), 14);
  if (typeof rsiValue !== "number") return;

  plot("RSI Heat", rsiValue, { color: heatScale.sample(rsiValue) });
}
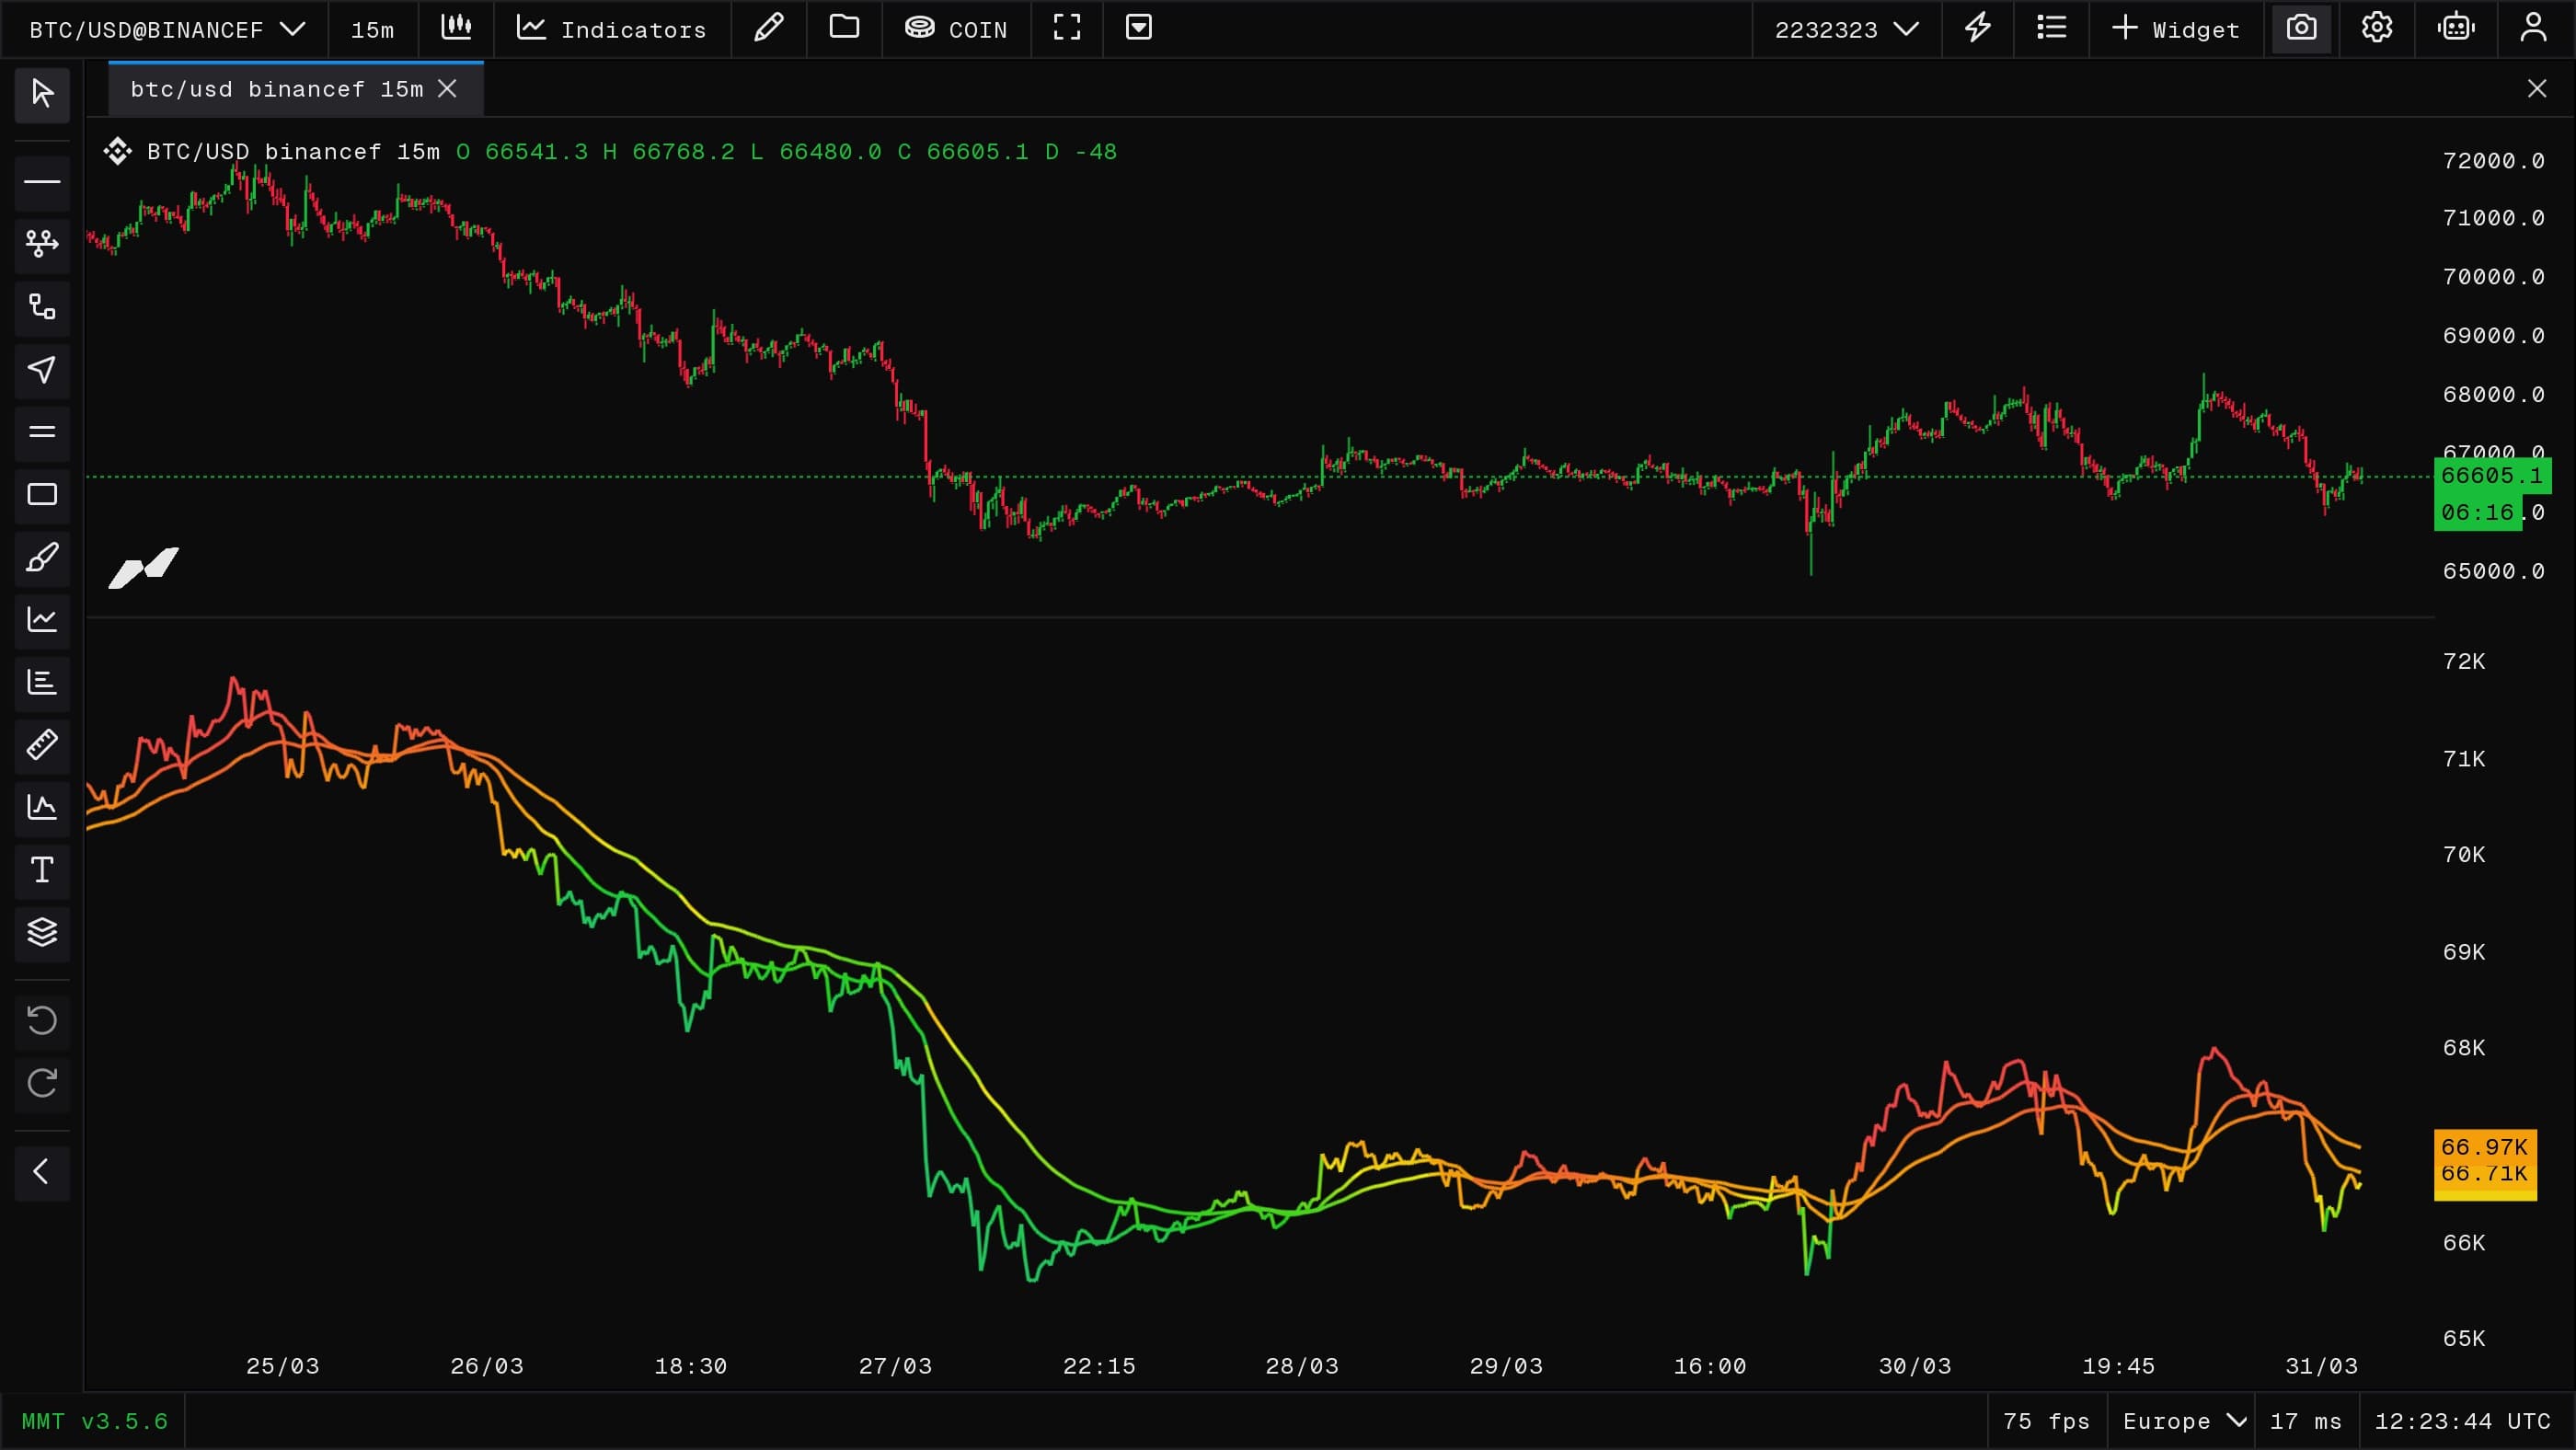
Using dynamic color.scale
Rebuild the scale from the current rolling range so the colors adapt to the local regime instead of a fixed global range.
//@version=2
indicator("Rolling Range Color Scale", false);

const candles = subscribe(data.OHLCV);

const lookback = input.int("Lookback", 150, { min: 20, max: 500 });
const fastLen = input.int("Fast EMA", 21, { min: 1 });
const slowLen = input.int("Slow EMA", 55, { min: 2, sameLine: true });

function onBar() {
  const close = candles.close();
  const low = ta.lowest(close, lookback);
  const high = ta.highest(close, lookback);
  const fast = ta.ema(close, fastLen);
  const slow = ta.ema(close, slowLen);

  if (typeof low !== "number" || typeof high !== "number") return;
  if (!(high > low)) return;

  const mid = (low + high) * 0.5;
  const scale = color.scale(
    [
      [low, "#22c55e"],
      [mid, "#f59e0b"],
      [high, "#ef4444"]
    ],
    {
      space: color.space.hsl,
      easing: color.easing.smootherstep
    }
  );

  plot("Close", close, {
    color: scale.sample(close),
    width: 2
  });

  if (typeof fast === "number") {
    plot("Fast EMA", fast, {
      color: scale.sample(fast),
      width: 2
    });
  }

  if (typeof slow === "number") {
    plot("Slow EMA", slow, {
      color: scale.sample(slow),
      width: 2
    });
  }
}
Fill Gradients
Gradient fills work well when the boundaries are simple and stable. A centered EMA with a volatility band keeps the example readable while still showing the full top-to-bottom color transition.
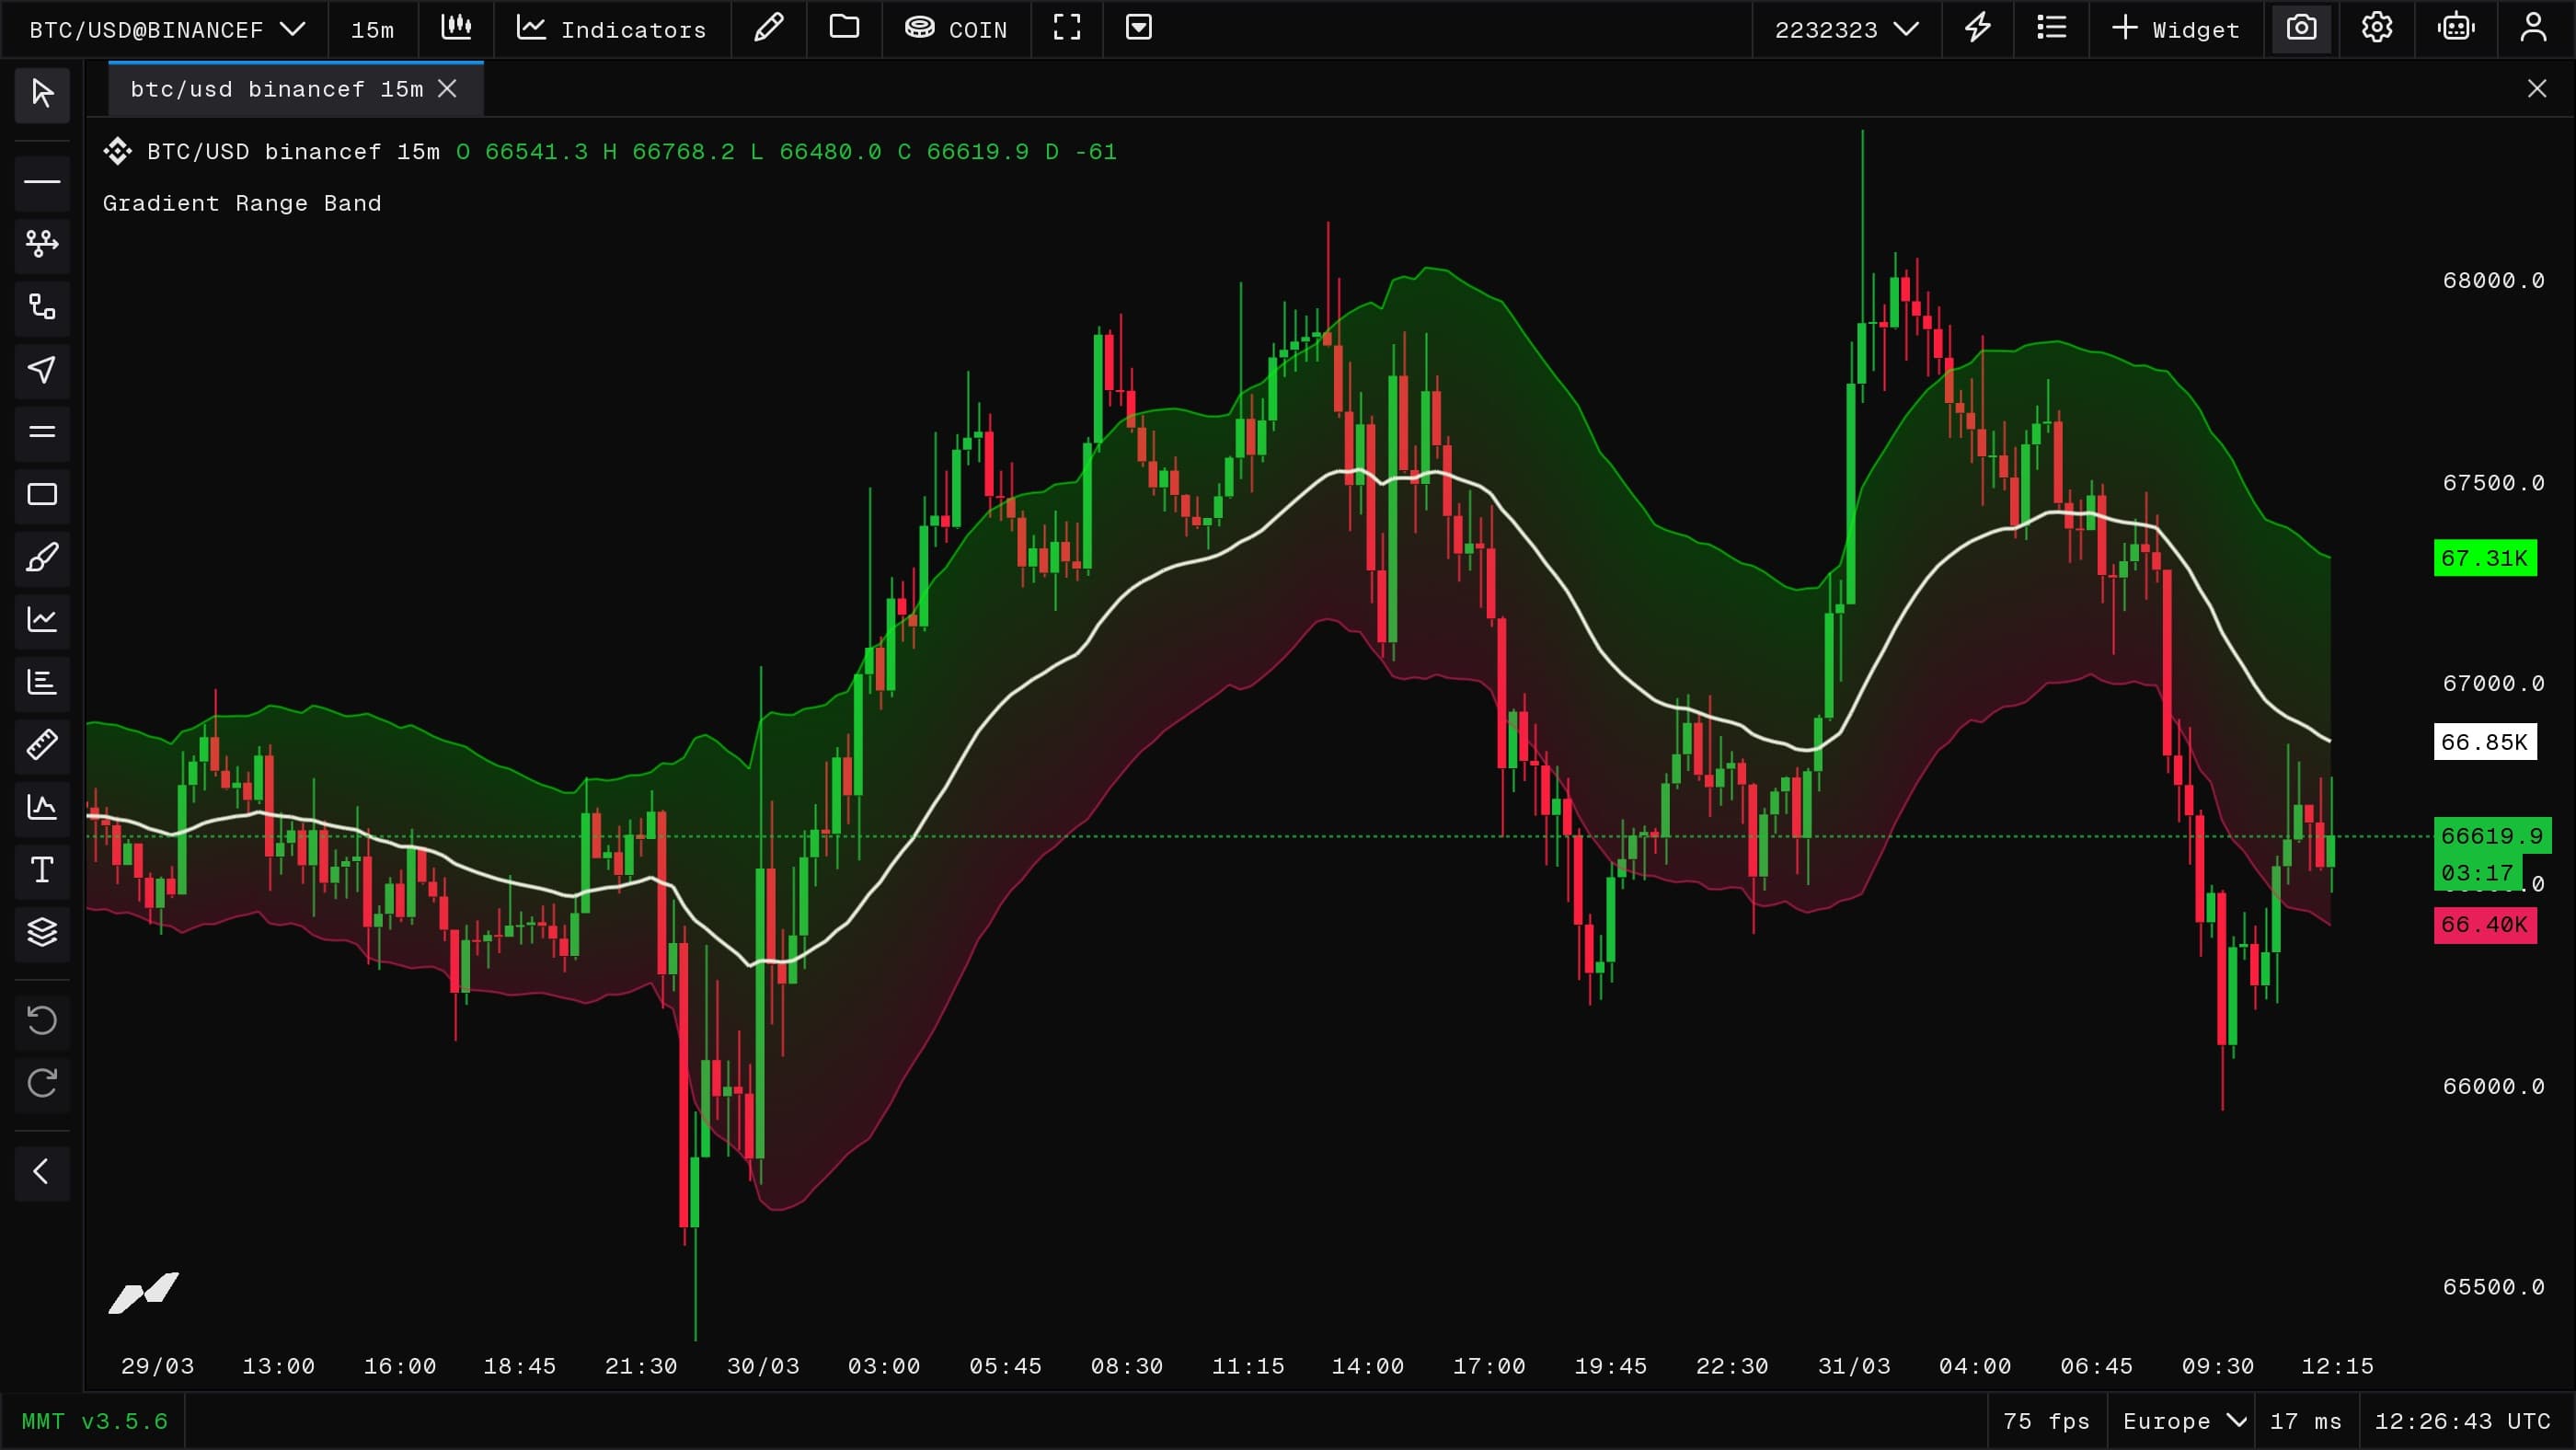
//@version=2
indicator("Gradient Range Band", true);

const candles = subscribe(data.OHLCV);

const upColor = input.color("Up Color", color.green);
const downColor = input.color("Down Color", color.red, { sameLine: true });

const length = input.int("Length", 34, { min: 1 });
const bandMult = input.float("Band Width", 1.8, { min: 0.5, max: 4 });

function onBar() {
  const basis = ta.ema(candles.close(), length);
  const spread = ta.ema(candles.high() - candles.low(), length);

  if (typeof basis !== "number" || typeof spread !== "number") return;

  const upper = basis + spread * bandMult;
  const lower = basis - spread * bandMult;

  const upperPlot = plot("Upper Band", upper, {
    color: color.transp(upColor, 35),
    width: 1,
  });

  const lowerPlot = plot("Lower Band", lower, {
    color: color.transp(downColor, 35),
    width: 1,
  });

  plot("Basis", basis, {
    color: color.white,
    width: 2,
  });

  fill(upperPlot, lowerPlot, {
    topValue: upper,
    bottomValue: lower,
    topColor: color.transp(upColor, 82),
    bottomColor: color.transp(downColor, 82)
  });
}