

Examples
Higher Timeframes
Examples using higher-timeframe subscriptions — HTF candles, overlays, and timeframe.change detection.
HTF Rollup Candles
Draws rolling higher-timeframe candles on the price chart using Box and Line entities. Each HTF bar gets a wick line and body box, colored by direction. The display name updates live with OHLC and percentage change.
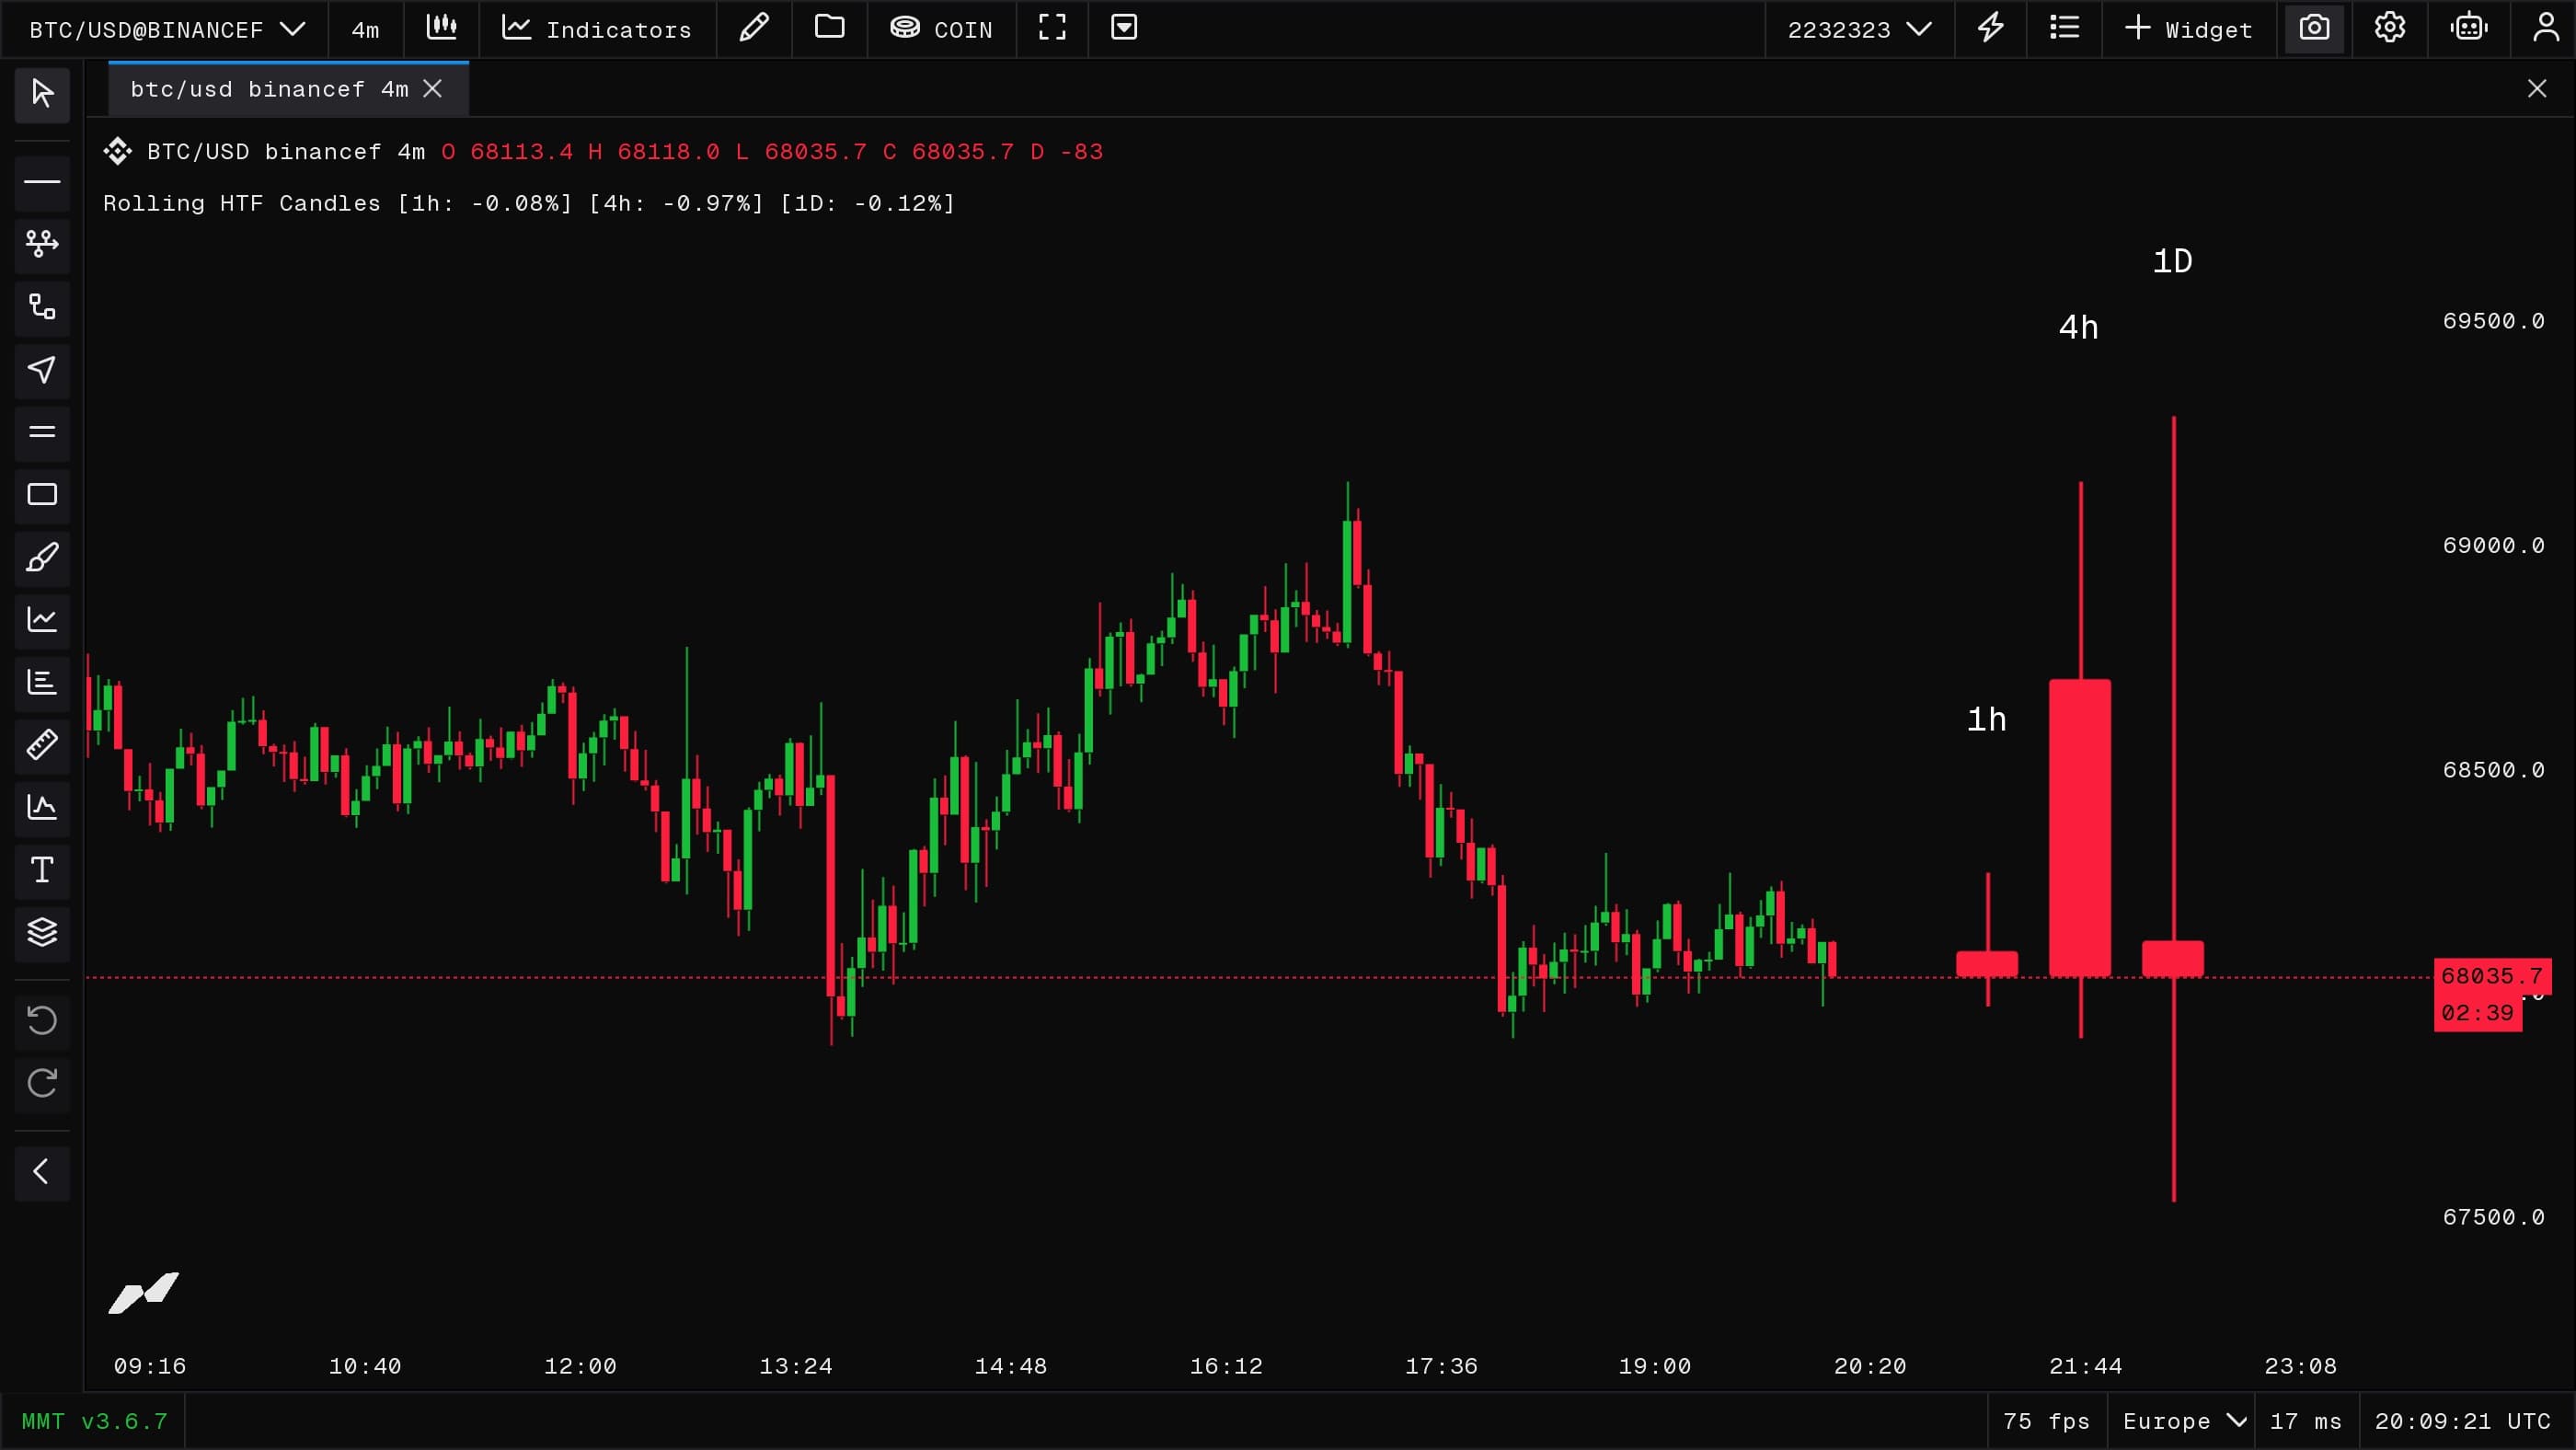
//@version=2
indicator("Rolling HTF Candles", true);

// Timeframes tab
input.tab("Timeframes", { key: "tab_timeframes" });

input.group("HTF Windows", {
  key: "grp_timeframes",
  collapsible: true,
  collapsed: false
});
const tf1 = input.timeframe("Timeframe 1", "1h", { key: "tf1" });
const tf2 = input.timeframe("Timeframe 2", "4h", { key: "tf2" });
const tf3 = input.timeframe("Timeframe 3", "1D", { key: "tf3" });

// Layout tab
input.tab("Layout", { key: "tab_layout" });

input.group("Projection Layout", {
  key: "grp_layout",
  collapsible: true,
  collapsed: false
});
const startBarsAhead = input.int("Start Bars Ahead", 12, {
  key: "startBarsAhead",
  min: 1,
  max: 300
});
const candleWidthBars = input.int("Candle Width Bars", 6, {
  key: "candleWidthBars",
  min: 1,
  max: 50
});
const gapBars = input.int("Gap Between Candles", 3, {
  key: "gapBars",
  min: 1,
  max: 100
});
const wickWidth = input.int("Wick Width", 2, {
  key: "wickWidth",
  min: 1,
  max: 10
});
const bodyRounding = input.int("Body Rounding", 2, {
  key: "bodyRounding",
  min: 0,
  max: 12
});
const labelSize = input.int("Timeframe Label Size", 24, {
  key: "labelSize",
  min: 8,
  max: 48
});
const hlLabelSize = input.int("H/L Label Size", 16, {
  key: "hlLabelSize",
  min: 8,
  max: 32
});
const labelGapPct = input.float("Main Label Gap %", 0.5, {
  key: "labelGapPct",
  min: 0.01,
  max: 20
});
const hlExtraGapPct = input.float("H/L Extra Gap %", 0.35, {
  key: "hlExtraGapPct",
  min: 0.01,
  max: 20
});

// Style tab
input.tab("Style", { key: "tab_style" });

input.group("Colors", {
  key: "grp_colors",
  collapsible: true,
  collapsed: false
});
const upColor = input.color("Up", "#18BD39FF", {
  key: "upColor"
});
const downColor = input.color("Down", "#FB1E3CFF", {
  key: "downColor",
  sameLine: true
});
const textColor = input.color("Text", color.white, {
  key: "textColor"
});

// Checks tab
input.tab("Checks", { key: "tab_checks" });

input.group("Checks", {
  key: "grp_checks",
  collapsible: true,
  collapsed: false
});
const showHlCheckLabels = input.bool("Show H/L Check Labels", false, {
  key: "showHlCheckLabels"
});

const chart = subscribe(data.OHLCV);

const wick1 = Line("roll_wick_1");
const wick2 = Line("roll_wick_2");
const wick3 = Line("roll_wick_3");

const body1 = Box("roll_body_1");
const body2 = Box("roll_body_2");
const body3 = Box("roll_body_3");

const topLabel1 = Label("roll_top_label_1", { text: "" });
const topLabel2 = Label("roll_top_label_2", { text: "" });
const topLabel3 = Label("roll_top_label_3", { text: "" });

const highCheckLabel1 = Label("roll_high_check_label_1", { text: "" });
const highCheckLabel2 = Label("roll_high_check_label_2", { text: "" });
const highCheckLabel3 = Label("roll_high_check_label_3", { text: "" });

const lowCheckLabel1 = Label("roll_low_check_label_1", { text: "" });
const lowCheckLabel2 = Label("roll_low_check_label_2", { text: "" });
const lowCheckLabel3 = Label("roll_low_check_label_3", { text: "" });

function priceText(value) {
  return str.toString(value, "mintick");
}

function signedPercentText(value) {
  if (!math.isFinite(value)) return "na";
  const text = str.toString(value, "percent");
  return value > 0 ? str.format("+{0}", text) : text;
}

function candleChange(candle) {
  if (!candle) return NaN;
  if (!math.isFinite(candle.open) || !math.isFinite(candle.close)) return NaN;
  if (candle.open === 0) return NaN;
  return candle.close / candle.open - 1;
}

function candleSummary(tfSeconds, candle) {
  const tfText = timeframe.fromSeconds(tfSeconds);
  const pctText = signedPercentText(candleChange(candle));
  return str.format("[{0}: {1}]", tfText, pctText);
}

function rollingCandle(src, windowSeconds) {
  if (!math.isFinite(windowSeconds) || windowSeconds <= 0) return null;
  if (windowSeconds < context.timeframe) return null;

  const latestUnix = src.unix();
  if (!math.isFinite(latestUnix)) return null;

  const cutoffUnix = latestUnix - windowSeconds + context.timeframe;

  let firstOffset = -1;
  let high = -Infinity;
  let low = Infinity;

  for (let i = 0; i < barCount(); i++) {
    const ts = src.unix(i);
    if (!math.isFinite(ts)) break;
    if (ts < cutoffUnix) break;

    const hi = src.high(i);
    const lo = src.low(i);
    if (!(math.isFinite(hi) && math.isFinite(lo))) return null;

    if (hi > high) high = hi;
    if (lo < low) low = lo;
    firstOffset = i;
  }

  if (firstOffset < 0) return null;

  const open = src.open(firstOffset);
  const close = src.close();

  if (!(math.isFinite(open) && math.isFinite(close))) return null;

  return {
    open: open,
    high: high,
    low: low,
    close: close
  };
}

function drawProjectedCandle(
  candle,
  tfSeconds,
  slot,
  anchorUnix,
  wick,
  body,
  topLabel,
  highCheckLabel,
  lowCheckLabel
) {
  if (!candle) return;

  const o = candle.open;
  const h = candle.high;
  const l = candle.low;
  const c = candle.close;

  const strideBars = candleWidthBars + gapBars;
  const leftX =
    anchorUnix + (startBarsAhead + slot * strideBars) * context.timeframe;
  const rightX = leftX + candleWidthBars * context.timeframe;
  const midX = leftX + (rightX - leftX) / 2;

  let top = math.max(o, c);
  let bottom = math.min(o, c);

  if (top === bottom) {
    const dojiPad = math.max(math.abs(c) * 0.0001, 0.00000001);
    top += dojiPad;
    bottom -= dojiPad;
  }

  const candleColor = c >= o ? upColor : downColor;

  const baseTopGap = math.max(math.abs(h) * (labelGapPct / 100), 0.00000001);
  const extraTopGap = math.max(math.abs(h) * (hlExtraGapPct / 100), 0.00000001);
  const lowGap = math.max(math.abs(l) * (labelGapPct / 100), 0.00000001);

  wick.set({
    x1: midX,
    y1: h,
    x2: midX,
    y2: l,
    width: wickWidth,
    color: candleColor
  });

  body.set({
    x1: leftX,
    y1: top,
    x2: rightX,
    y2: bottom,
    color: candleColor,
    rounding: bodyRounding
  });

  topLabel.set({
    x: midX,
    y: h + baseTopGap,
    text: timeframe.fromSeconds(tfSeconds),
    color: textColor,
    size: labelSize,
    textAlign: text.align.center
  });

  highCheckLabel.set({
    x: midX,
    y: showHlCheckLabels ? h + baseTopGap + extraTopGap : h,
    text: showHlCheckLabels ? str.format("H {0}", priceText(h)) : "",
    color: textColor,
    size: hlLabelSize,
    textAlign: text.align.center
  });

  lowCheckLabel.set({
    x: midX,
    y: showHlCheckLabels ? l - lowGap : l,
    text: showHlCheckLabels ? str.format("L {0}", priceText(l)) : "",
    color: textColor,
    size: hlLabelSize,
    textAlign: text.align.center
  });
}

function onBar(index) {
  if (!context.isLast) return;

  const anchorUnix = chart.unix();

  const c1 = rollingCandle(chart, tf1);
  const c2 = rollingCandle(chart, tf2);
  const c3 = rollingCandle(chart, tf3);

  setDisplayName(
    str.format(
      "Rolling HTF Candles {0} {1} {2}",
      candleSummary(tf1, c1),
      candleSummary(tf2, c2),
      candleSummary(tf3, c3)
    )
  );

  drawProjectedCandle(
    c1,
    tf1,
    0,
    anchorUnix,
    wick1,
    body1,
    topLabel1,
    highCheckLabel1,
    lowCheckLabel1
  );

  drawProjectedCandle(
    c2,
    tf2,
    1,
    anchorUnix,
    wick2,
    body2,
    topLabel2,
    highCheckLabel2,
    lowCheckLabel2
  );

  drawProjectedCandle(
    c3,
    tf3,
    2,
    anchorUnix,
    wick3,
    body3,
    topLabel3,
    highCheckLabel3,
    lowCheckLabel3
  );
}
HTF Candles using Boxes and Lines
Draws higher-timeframe candles on the price chart using Box and Line entities. Each HTF bar gets a wick line and body box, colored by direction. The display name updates live with OHLC and percentage change.
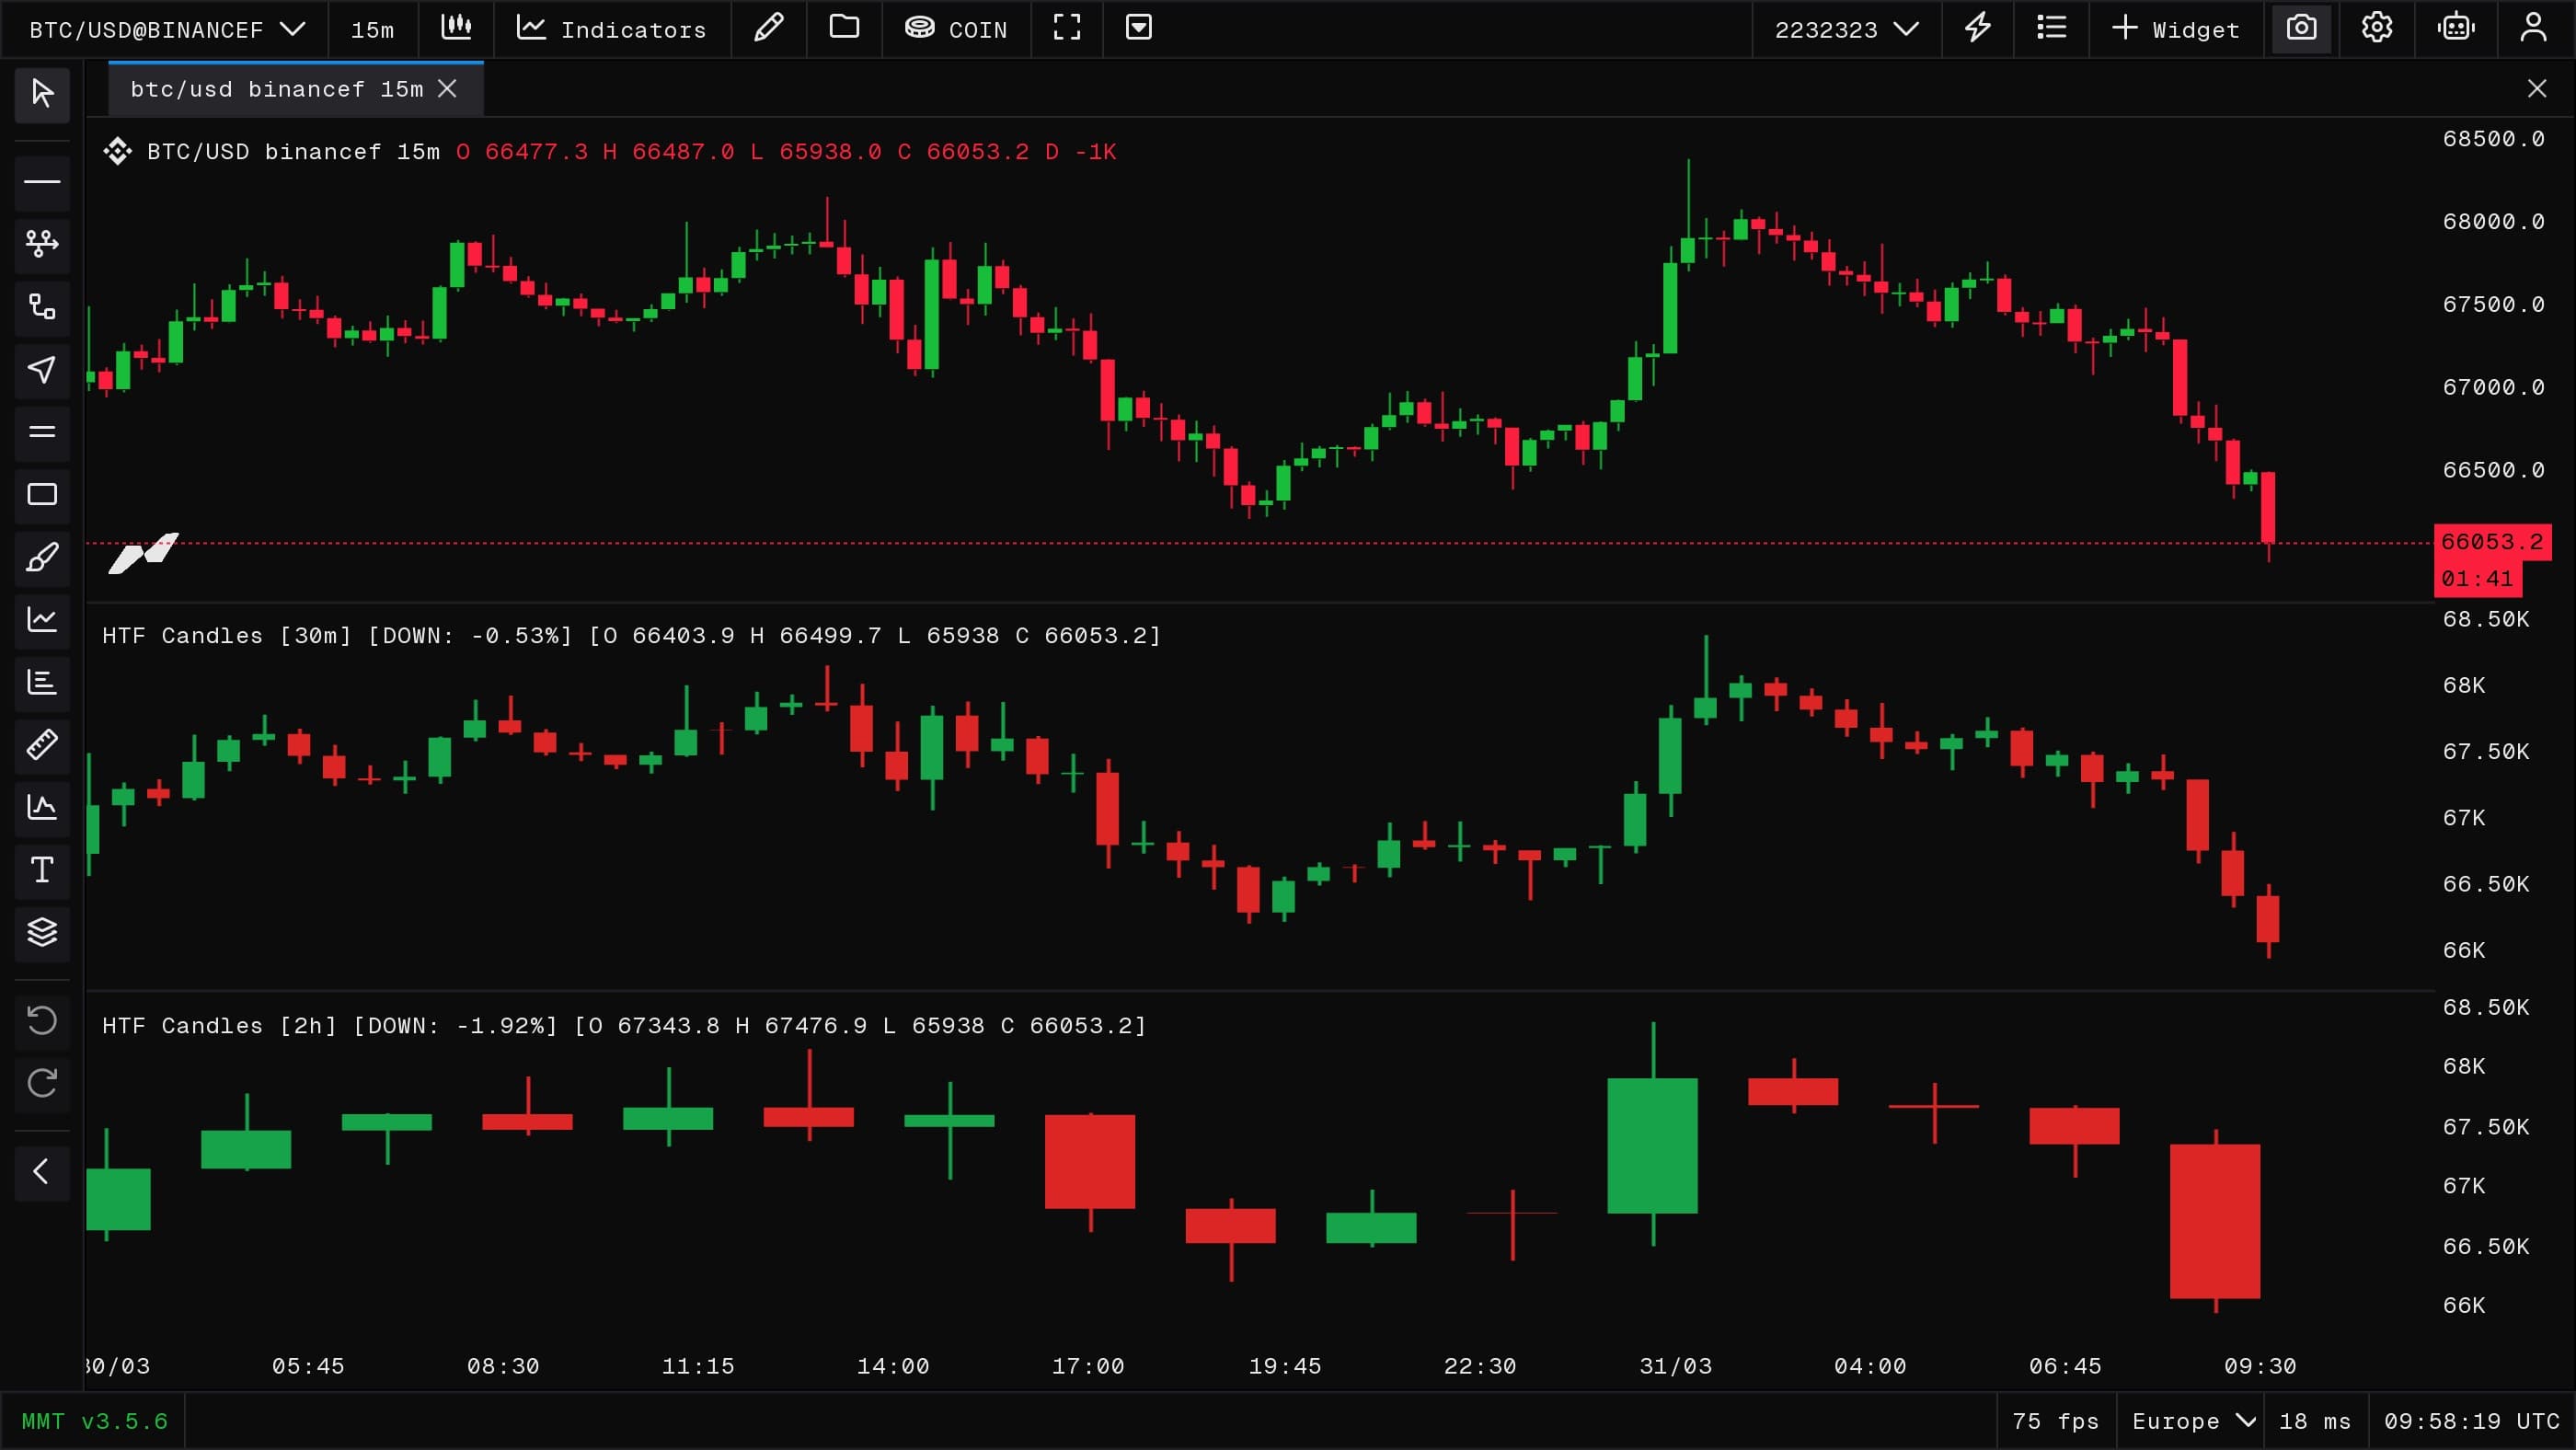
//@version=2
indicator("HTF Candles", false);

// Inputs
const tf = input.timeframe("Timeframe", "30m", { key: "tf" });
const upColor = input.color("Up", "#16a34a");
const downColor = input.color("Down", "#dc2626", { sameLine: true });

const htf = subscribe(data.OHLCV, { timeframe: tf });
const wicks = {};
const bodies = {};

function ensureLine(id) {
  let h = wicks[id];
  if (!h) {
    h = Line("wick-" + id);
    wicks[id] = h;
  }
  return h;
}

function ensureBox(id) {
  let h = bodies[id];
  if (!h) {
    h = Box("body-" + id);
    bodies[id] = h;
  }
  return h;
}

function candleColors(open, close) {
  const up = close >= open;
  return {
    wick: up ? upColor : downColor,
    body: up ? upColor : downColor
  };
}

function signedPercentText(value) {
  if (!math.isFinite(value)) return "na";
  const text = str.toString(value, "percent");
  return value > 0 ? str.format("+{0}", text) : text;
}

function candleChange(open, close) {
  if (!math.isFinite(open) || !math.isFinite(close) || open === 0) return NaN;
  return close / open - 1;
}

function drawCandle(id, start, end, open, high, low, close) {
  if (na(start) || na(end) || na(open) || na(high) || na(low) || na(close))
    return;

  const span = end - start;
  if (span <= 0) return;

  const mid = start + span * 0.5;
  const pad = span * 0.18;
  const top = math.max(open, close);
  const bottom = math.min(open, close);
  const c = candleColors(open, close);

  ensureLine(id).set({
    x1: mid,
    y1: low,
    x2: mid,
    y2: high,
    color: c.wick,
    width: 2
  });

  ensureBox(id).set({
    x1: start + pad,
    y1: top,
    x2: end - pad,
    y2: bottom,
    color: c.body
  });
}

function onBar() {
  const start = htf.unix();
  const open = htf.open();
  const high = htf.high();
  const low = htf.low();
  const close = htf.close();

  if (na(start) || na(open) || na(high) || na(low) || na(close)) return;

  const tfText = timeframe.fromSeconds(tf);
  const change = candleChange(open, close);
  const dirText = close >= open ? "UP" : "DOWN";

  setDisplayName(
    str.format(
      "HTF Candles [{0}] [{1}: {2}] [O {3} H {4} L {5} C {6}]",
      tfText,
      dirText,
      signedPercentText(change),
      str.toString(open, "mintick"),
      str.toString(high, "mintick"),
      str.toString(low, "mintick"),
      str.toString(close, "mintick")
    )
  );

  // Draw/update current provisional HTF candle
  drawCandle("" + start, start, start + tf, open, high, low, close);

  // When a new HTF period begins, finalize the previous one using exact boundaries
  if (timeframe.change(tf)) {
    const prevStart = htf.unix(1);

    if (!na(prevStart) && start > prevStart) {
      drawCandle(
        "" + prevStart,
        prevStart,
        start,
        htf.open(1),
        htf.high(1),
        htf.low(1),
        htf.close(1)
      );
    }
  }
}